
On this page
Galileo brings tracing, Luna evaluator models, agent metrics, and runtime guardrails into one platform. Cisco announced the acquisition on April 9, 2026, closed it on May 22, 2026, and folded Galileo into Splunk. Galileo’s release notes state: “As of August 7, 2026, Galileo is now Splunk Agent Observability.” Customers who onboarded before that date keep the galileo.ai product and docs. Everyone after it is sent to Splunk.
Either way, the acquisition changes the buying decision. You now have a new product path to consider on top of Galileo’s existing plan limits, a new pricing model, and different deployment requirements.
We reviewed the 7 best Galileo alternatives, from trace-first observability tools to eval platforms and replay-based testing.
A Quick Overview of the Best Galileo Alternatives
- Why look for alternatives: Cisco completed its acquisition of Galileo on May 22, 2026. Galileo’s technology is now offered as Splunk Agent Observability. On the standalone product, SSO, private deployment, real-time guardrails, and the Luna-2 evaluator models are on the Enterprise plan, and the published pricing stopped at 50,000 traces per month.
- Who should care: AI engineers and platform teams running agents in production who want more control over evals, self-hosting, costs, or how production failures become regression tests.
- What to expect: 7 alternatives, from replay-based evals in Kitaru to eval-first platforms, open-source trace stores, and enterprise control planes (Arize AX, Fiddler).
- Which Galileo: The Galileo plans discussed below are legacy offerings. Existing customers should confirm their applicable pricing and entitlements under their contract. If you are evaluating fresh, the product is sold as Splunk Agent Observability on Splunk’s terms, so read the vendor’s current page first.
The Need for a Galileo Alternative?
Galileo still covers a lot of ground. The reasons to look elsewhere are more practical: ownership change, what the entry plans leave out, how the price scales, and what it takes to run it yourself.
1. Galileo Is Now Splunk Agent Observability
If you’ve onboarded before August 7, 2026, you’re pointed to docs.galileo.ai. If you onboarded after, you’re pointed to agent-observability-docs.splunk.com. Splunk prices the product differently. Splunk starts at $100 per month, billed annually, for 1.2 million spans per year. It also includes 500 million Luna tokens and five Luna fine-tuning runs per year. The roadmap, contract, and support path now belong to Splunk Observability.
2. Important Production Features Require Enterprise
Galileo’s pricing page reserved four production features for Enterprise:
- SSO
- Private VPC or on-prem deployment
- Real-time guardrails
- Low-latency dedicated inference servers
The Luna-2 docs gate the evaluator models too: “Luna-2 is only available in the Enterprise tier of Galileo.” A small team may need private deployment, SSO, or runtime protection well before it is ready for an enterprise contract, and neither Galileo’s old plans nor Splunk’s single published price changes that.
3. Costs Above Pro Are Hard to Estimate Publicly
Until autumn 2026, galileo.ai listed a Free plan with 5,000 traces per month, unlimited users, and unlimited custom evals, and a Pro plan at $100 per month, billed yearly, for 50,000 traces. A footnote said pricing scales with trace volume and never published the next price point. That page is gone: galileo.ai/pricing now redirects to Splunk’s pricing page, so those plans apply only to customers who already have them.
Once you pass the listed Pro allowance, you need sales to estimate the bill. For example, an agent handling 3,000 conversations a day at one trace per conversation would cross 50,000 traces in about 17 days.
Splunk publishes a starting price of $100 per month, billed annually, for 1.2 million spans per year. Buyers should confirm pricing for additional Luna tokens, extended retention, and their required deployment.
That doesn’t necessarily mean Galileo is expensive. However, budget-conscious buyers or those in the early stages of finding a Galileo alternative would prefer a direct number rather than waiting to discuss it with a sales rep.
Evaluation Criteria
We compared each Galileo alternative against four questions that matter once an agent reaches production.
- Evaluation accuracy on real workloads: Can you compare an evaluator’s judgment with labels from people who know the task? A score is only useful if it matches what your team considers acceptable behavior.
- Custom evaluators and execution flexibility: Can you bring your own scoring code, judge model, and dependencies? Galileo supports registered Python metrics in a server-side sandbox with declared dependencies, plus local Python scorers that can use arbitrary libraries and call external APIs.
- Tracing complex agent workflows: Can the platform capture tool calls, nested agents, parallel work, and requests that cross service boundaries? OpenTelemetry support also matters if you want instrumentation that is easier to move between vendors.
- Turning production failures into tests: How easily can a failed trace become a versioned test case with its inputs, expected outcome, and context preserved? This is the criterion where the tools differ most, so each entry names the trace-to-test path.
What are the Top Alternatives to Galileo
| Galileo Alternative | Best For | Key Features | Pricing |
|---|---|---|---|
| Kitaru | Testing the next change against recorded production sessions | • Replays your real agent code with recorded tool results • Immutable cohorts and CI-gated experiments | • Free (Open source) • Paid plans start at $39/month |
| Arize AX | Enterprise teams that want online evals on every span | • LLM, code, agent, and HTTP-endpoint evaluators • Failing traces saved to datasets | • Free • Paid plans start at $50/month |
| Braintrust | Eval-first teams that gate merges on scores | • Code and LLM scorers in TypeScript or Python • “Add to dataset” from production logs | • Free • Paid plans start at $249/month |
| LangSmith | LangGraph and LangChain teams | • Align Evaluator checks judges against human labels • Annotation queues feed datasets | • Free • Paid plans start at $39/seat/month |
| Comet Opik | The cheapest flat-rate hosted tier with an Apache 2.0 core | • Test Suites built from failed traces • 30+ built-in metrics, custom metrics in Python | • Free (Open source) • Paid plans start at $19/month |
| Langfuse | Teams that want the trace store on their own infrastructure | • MIT core, OTLP endpoint • Versioned datasets from any observation | • Free (Open source) • Paid plans start at $29/month |
| Fiddler AI | Enterprises running ML models and agents under one control plane | • Guardrails on free Centor models • Evaluator Rules on production spans | • Free (guardrails) • Developer at $0.002 per trace |
1. Kitaru by ZenML
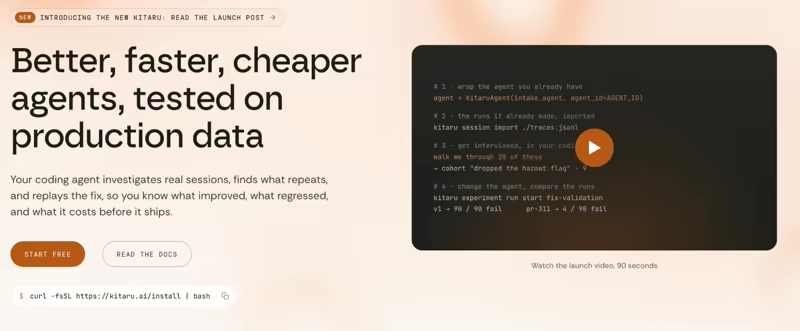
Kitaru, built by the team behind ZenML, is an open-source tool that reads your agent’s traces and makes them runnable. It is at version 0.27.6 (November 4, 2026) and still in beta. Your agent has already been tested thousands of times in production. Most of that evidence is sitting in a trace store as something you can read but not run.
It imports the sessions you already collect from Langfuse, LangSmith, Braintrust, Logfire, Arize Phoenix, or MLflow, or records new ones through an adapter.
Analyzers then read every session at once and surface the patterns. You turn what you find into evaluators, and Kitaru re-executes your agent’s real code against the sessions that failed, so you can test a prompt, model, parameter, or code change on cases your agent has already seen.
During a controlled replay, Kitaru can answer matching tool calls from recorded history instead of calling the live system. For side-effecting tools such as refunds or database writes, you can use history with on_miss=“fail” so an unrecorded call stops instead of executing live.
It doesn’t replace Galileo’s live dashboards, and doesn’t try to replace your agent framework or primary trace store. Instead, it turns selected production sessions into executable regression cases.
Here’s how:
Feature 1. Replay Real Agent Code Against Recorded Tool History

Kitaru’s replay starts your agent from the top with the original inputs, and a tool policy decides what each tool call receives.
For supported tools governed by a history policy, matching calls receive recorded results. Set on_miss to fail to stop unmatched calls from executing live; passthrough executes the live tool. Policy support varies by adapter.
on_miss handles a call the baseline never made. fail stops the replay, error_result hands the agent an error, and passthrough runs the live tool. This is useful when you need to test a refund agent without issuing the refund again.
With no policy set, the default is passthrough, which runs live tools, so set the policy deliberately.
Feature 2. Test One Change Across a Frozen Production Cohort

A replay carries an optional override, which can swap the model, rewrite the system or user prompt, or adjust model_params and run that candidate across an immutable cohort.
A result that says 12 of 14 sessions improved stays checkable against exactly those 14 sessions. The regression suite guides wire that into CI. You register the pull request’s code as an agent version and run kitaru experiment run start ... --wait, which exits nonzero on failure. Kitaru’s bundled dashboard shows baseline and replay side by side.
Feature 3. Run Versioned Evaluators on Your Own Workers
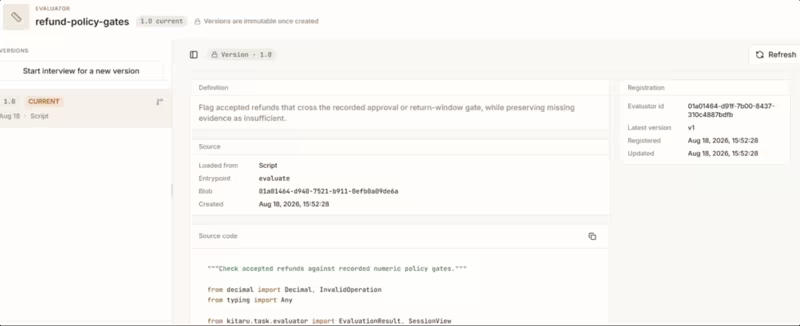
An evaluator is a callable that reads the complete session and returns typed results. An LLM judge is an evaluator that happens to call a model, with its client library declared inline (PEP 723) and installed by a Kitaru worker.
Kitaru workers run in your environment, alongside your agent’s dependencies and credentials, so evaluator code can use the libraries and model keys available there. Ten deterministic evaluators ship in kitaru-evaluator, and a separate kitaru-typesafe-evaluator package adds a typed judge with yes/no, choice, and score questions. There is no large judge catalog beyond these built-ins.
Feature 4. Turn Human Review Into Evaluator Calibration Data

Where do the criteria come from? Kitaru’s answer starts with insights. When explicitly selected for an import, analyzers inspect its eligible completed or failed sessions and surface patterns: failed tool calls, repeated calls, how outcomes split, cost concentrated in a few sessions, and model input that grows within a session. The built-in analyzer needs no model or API key, and each insight links to the sessions behind it with a briefing your coding agent can pick up. From there, investigations put a reviewer in front of the evidence.
Kitaru lets you review selected sessions through investigations. Through the kitaru-investigation skill and Kitaru’s MCP review tools, your coding agent picks the sessions worth a reviewer’s time, asks one question per session, and highlights the evidence. Then a reviewer answers in context and gives each session a verdict of acceptable, problematic, or uncertain. Each answer becomes an annotation cited next to the exact evidence. The reviewer sees one question and the highlighted evidence, not the nested trace tree a Langfuse or Braintrust annotation queue puts in front of them.
You calibrate evaluators against those annotations before they gate anything. The sessions confirmed as problematic become the next regression cohort. Kitaru has no assignment queues and no multi-reviewer scoring.
Pricing
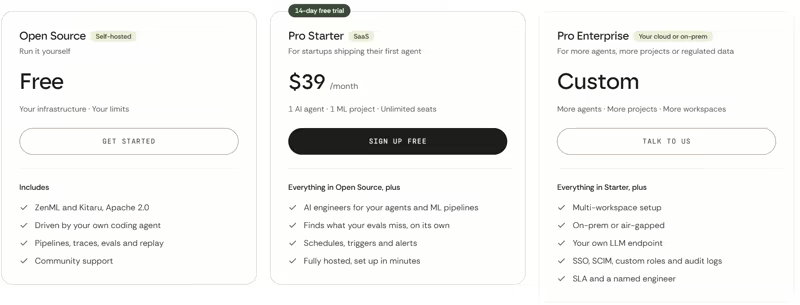
Kitaru is free to self-host under Apache 2.0, with unlimited recording, imports, cohorts, evaluators, experiment runs, and replay on your own workers. One-line install: curl -fsSL https://kitaru.ai/install | bash, and kitaru login --local starts the server in Docker or Podman.
The hosted option is ZenML Pro, which hosts Kitaru for your team and adds AI engineers that read every new trace next to your evals. Pro Starter offers a 14-day free trial with no credit card. Pro Enterprise has custom pricing:
- Pro Starter: $39 per month; 1 AI agent, 1 ML project, unlimited seats, hosted dashboard, schedules, triggers and alerts.
- Pro Enterprise: Custom; more agents and projects, on-prem or air-gapped deployment, your own LLM endpoint, SSO, SCIM, custom roles and audit logs, and an SLA.
Pros and Cons
Kitaru’s strength is the experiment nobody else here can run: your real code against real production sessions, with tool side effects held back and the test population frozen across experiments. It runs on a single FastAPI server with Postgres as the only stateful dependency.
The boundaries are just as important. Kitaru is not a live production observability platform or runtime guardrail layer. There is no OpenTelemetry ingestion endpoint yet, replay needs a runnable agent version registered with Kitaru, and there is no Galileo importer: your path from Galileo is a JSONL export or a one-page custom importer. It is a young project, and the at-scale hardening you would expect from a vendor of Galileo’s size is not there yet.
2. Arize AX
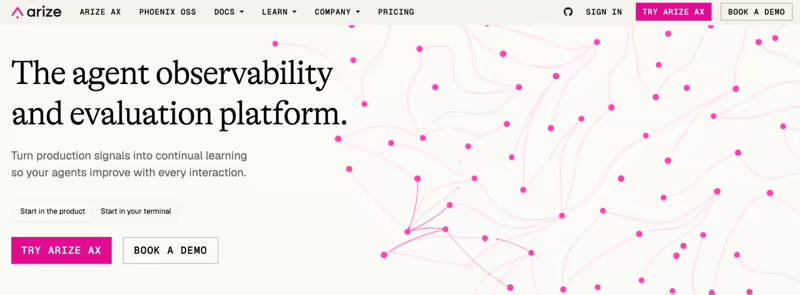
Arize AX is Arize’s managed observability and evaluation platform. It’s the closest like-for-like Galileo alternative with production tracing, online evals, human annotation, and enterprise self-hosting.
Dynatrace announced its $915 million acquisition agreement with Arize on August 13, 2026, and completed the acquisition on October 1, 2026. Dynatrace says Arize AX stays a standalone product and Phoenix stays open source.
Features
- Run evaluators that go beyond Galileo’s two custom-metric types. You can use LLM judges, deterministic code, agent-based evaluators, or an HTTP endpoint you host. A remote evaluator runs on your infrastructure with any dependency.
- Write Python code evaluators inside Arize’s hosted sandbox whose package list is fixed to numpy, pandas, scipy, pydantic, jellyfish, and the Arize datasets client. You can use this for scoring logic that fits those dependencies and does not need your own runtime.
- Use Online evals to score production traces and the tracing UI to save failing traces for later testing. Those become your regression suite for future prompt tweaks, or any other fix. It also gives you a connected path from a production issue to a regression dataset.
Pricing
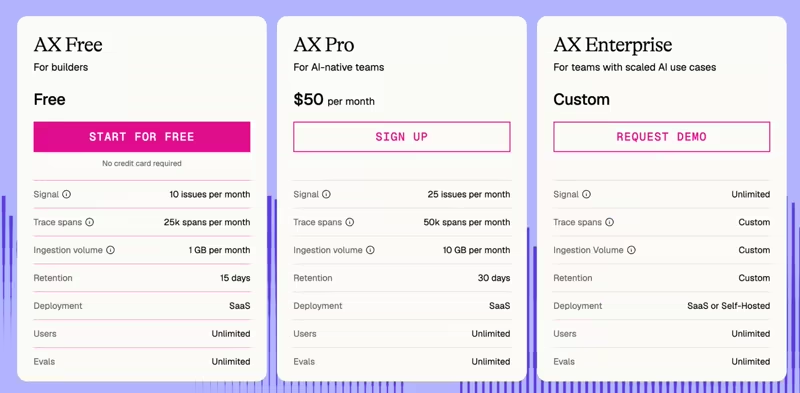
Arize publishes three AX plans, all with unlimited seats and evals:
- AX Free: $0
- AX Pro: $50 per month
- AX Enterprise: Custom
Pros and Cons
Arize AX keeps what Galileo users like, having experiments and evaluations next to the production traces, in one place. It also includes human annotation, OpenTelemetry-based tracing, and Enterprise self-hosting. Its trace view is best for showing what happened across an agent workflow.
That said, Arize does not remove every Galileo plan-gating concern. SSO and self-hosting still require Enterprise. Setup takes time because you still need to configure instrumentation and evaluation around your workflow.
Arize’s own evaluator skill notes that the evaluation index can lag by one to two hours.
Read more in our Arize AI alternatives guide.
3. Braintrust
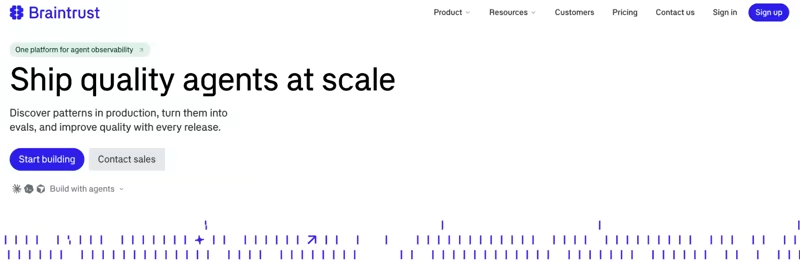
Braintrust is the eval-first platform in this space. Datasets, scorers, and experiments are the core objects, and production logging feeds them. It fits teams that want the same evaluation workflow to cover local development, CI, and production scoring.
Features
- Write scorers in TypeScript or Python. Braintrust supports code scorers, LLM-as-a-judge, or its pre-built autoevals library. This gives eval-heavy teams one scoring layer for deterministic checks, model judges, and reusable metrics.
- Score production traces as they arrive. Online scoring runs code or LLM scorers at a configurable sample rate. Use it to watch quality signals in production without scoring every trace.
- Promote a production log into a versioned dataset. Add to dataset maps a log’s input to the row’s input and its output to
expected. Theoriginlink points back to the source span, which is useful when a production failure deserves a permanent regression case. - Continue traces across services, you can export a span from one process and resume it in another. This helps when one agent request crosses workers, services, or queues before it finishes.
Pricing
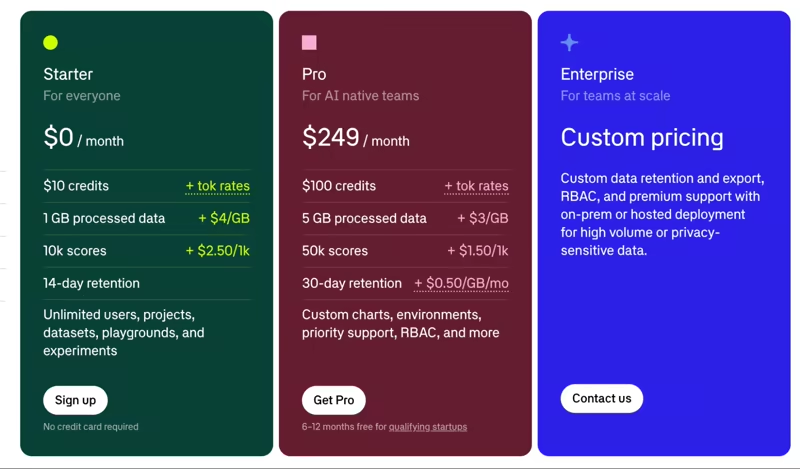
Braintrust offers a free plan with 10k scores, 14-day retention, and $10 in credits. Then it charges a flat rate per plan and meters processed data and scores on every plan:
- Pro: $249 per month
- Enterprise: Custom pricing
Pros and Cons
Braintrust is the strongest choice if datasets, scorers, and CI gates are how your team wants to work. Its Add to dataset workflow is the cleanest production-to-regression path of the hosted tools. You can take a useful or failed production trace, add it to a dataset, and keep that case around for future experiments.
Braintrust’s Pro subscription starts at $249 per month, but Starter has no platform fee and supports usage-based billing beyond its included allowances. The per-score meter compounds on chatty agent traces, self-hosting is Enterprise-only, and there is no open-source edition. Kitaru’s Braintrust importer fetches over the API, so combining the two needs no export step.
More in our Braintrust alternatives guide.
4. LangSmith
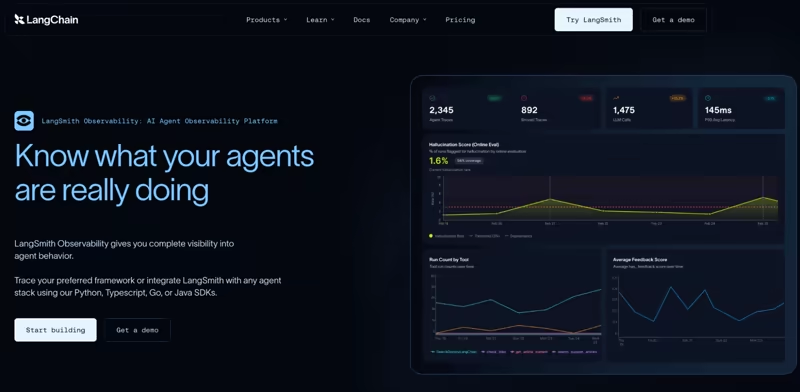
LangSmith is framework-agnostic on paper and deepest for LangGraph and LangChain teams. Two newer features, Align Evaluator and Tuned Evaluators, aim at the accuracy question Galileo answers with Luna-2 and continuous learning with human feedback (CLHF).
Features
- Use the Align Evaluator workflow to check an evaluator against human labels. It can grade examples in an annotation queue, then reports how often the evaluator agrees with the human judgment. It’s the closest peer here to Galileo’s CLHF.
- Use LangChain-managed Tuned Evaluators for common quality checks. LangChain writes, tests, versions, and maintains the prompt and judge model, so there’s little setup work, but as with Luna, you get less control over the judge.
- Run code or LLM-as-a-judge evaluators in Python or TypeScript, offline on datasets or online on production runs. Annotation queues can also transfer annotated runs to datasets, while distributed tracing carries trace context across service boundaries.
Pricing
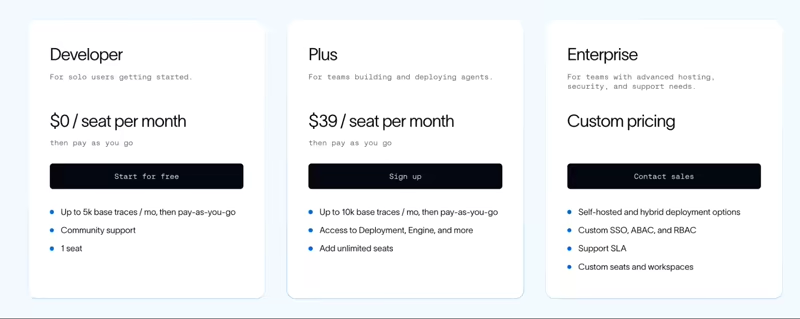
LangSmith offers a generous free plan for solo users with up to 5k base traces; then you pay as you go. Or, upgrade to its paid plans:
- Plus: $39 per seat per month
- Enterprise: Custom pricing
Pros and Cons
LangSmith earns its praise around debugging. You can measure your judge against human labels and compare the differences. That fit gets better for LangChain and LangGraph teams because tracing and evaluation sit close to the framework they already use.
The downside is how much product surface you have to learn. The dashboard can become busy once traces pile up or agent workflows get more complex. Pricing has several moving parts, including seats, base traces, and extra retention. Besides, Tuned Evaluators is still in Beta.
We cover LangSmith pricing and LangSmith alternatives separately.
5. Comet Opik
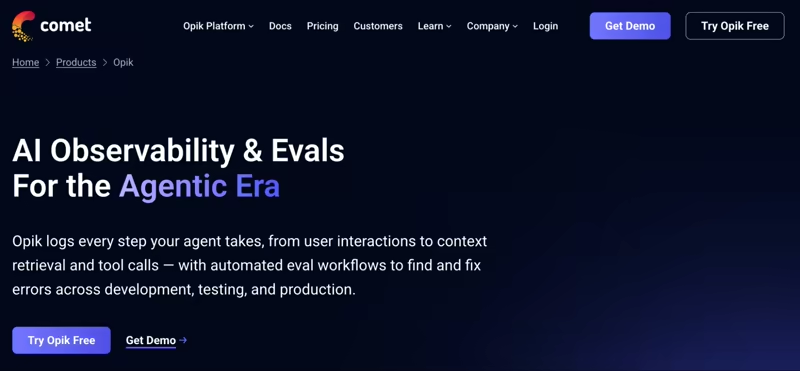
Opik is Comet’s open-source observability and evaluation platform. You can self-host the same codebase or use Comet Cloud. It has the cheapest flat-rate hosted tier in this list.
Features
- Turn failed traces into cases with natural-language assertions and have an LLM judge check it on future runs. This works well when a production failure can be described as a behavior the agent should or should not repeat.
- Choose from 30+ pre-built metrics or build custom ones in Python, so you can use your preferred model client or local code. Online evaluation rules can then score a percentage of production traces.
- Trace with OpenTelemetry and version your datasets. Opik supports OpenTelemetry tracing, while Add to dataset can move trace data into a dataset and store the output as
expected_output. Every dataset change creates a numbered version, which helps keep experiments tied to a known test set.
Pricing
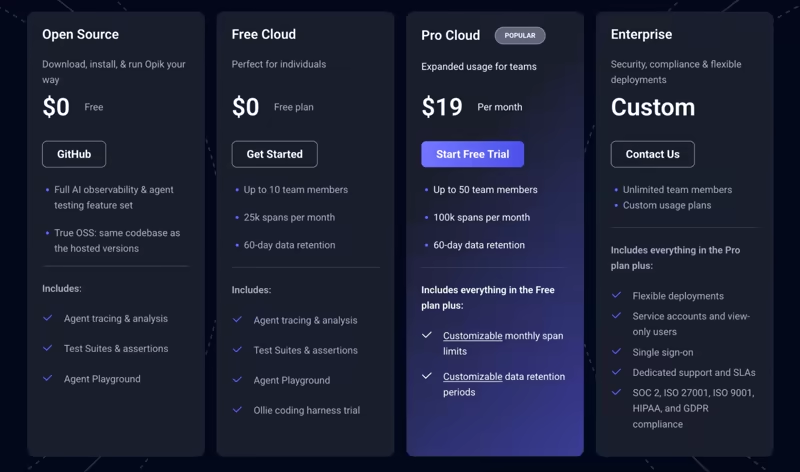
Comet prices Opik separately from experiment tracking. It still has an open-source version, free to self-host, and a free cloud with 25,000 spans per month. If those don’t feel sufficient, you can choose between two paid plans:
- Pro Cloud: $19 per month
- Enterprise: Custom pricing
Pros and Cons
Opik Pro Cloud costs $19 per month for 100,000 spans. Legacy Galileo Pro listed $100 per month, billed annually, for 50,000 traces. These allowances use different units: one trace can contain multiple spans. It also supports OpenTelemetry alongside Python and TypeScript SDKs, so you are not tied to one agent framework just to get traces into the platform.
Self-hosting requires operating the infrastructure, and Enterprise SSO remains on the custom plan. Opik also supports aligning LLM judges with human annotations and optimizing judge prompts against those labels. Kitaru has no Opik importer today, so pairing the two means a JSONL export or a custom importer.
Our Opik vs Langfuse vs Kitaru comparison goes deeper.
6. Langfuse
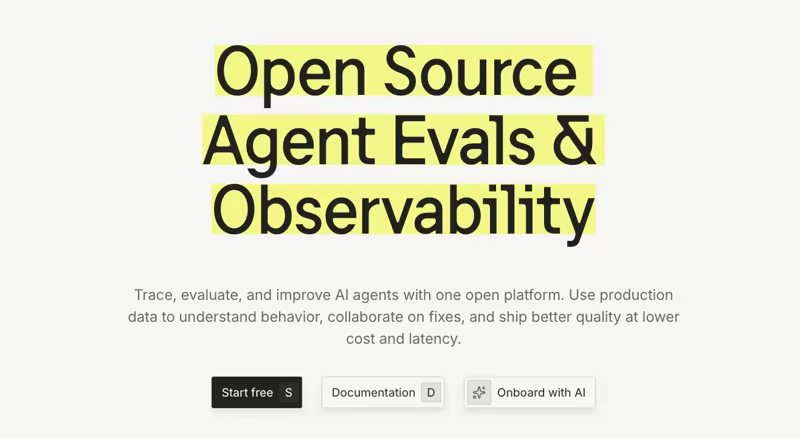
Langfuse is an open-source LLM engineering platform with an MIT-licensed core you can run on Docker or Kubernetes. It fits teams that want tracing, datasets, prompts, and evals without making the hosted product their only deployment option.
Features
- Run LLM-as-a-judge evaluators on your own LLM connection, so you choose the provider and pay the model bill directly, on production observations and dataset experiments alike.
- Add any observation to a versioned dataset. Add to dataset copies the input and lets you set the expected output. Every add, update, delete, or archive of dataset items produces a new dataset version, which helps keep experiment results tied to a known test set.
- Send traces through OpenTelemetry. Langfuse exposes an OTLP endpoint, and its SDK is built on the official OpenTelemetry client. This is useful if your tracing stack already speaks OTel and you want less vendor-specific instrumentation.
Pricing
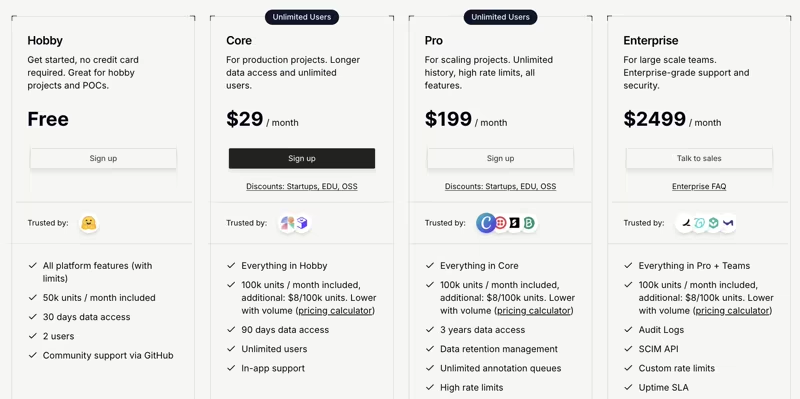
Langfuse meters units, where a unit is any trace, observation, or score. A starter Hobby plan gives a free entry point for 2 users with 50,000 units per month. After that, you can choose from a paid tier:
- Core: $29 per month
- Pro: $199 per month
- Enterprise: $2,499 per month
Pros and Cons
Langfuse puts the trace store, datasets, judge, and annotation queue in the open-source core, and its cloud plans include unlimited users from $29.
The self-hosting trade is the same one Galileo asks you to make: ClickHouse plus Postgres plus Redis plus blob storage is real operational work. One recent self-hoster said the stack consumed far more disk and memory than their observation data alone would suggest.
Kitaru has a Langfuse importer with direct API fetch. That’s why the two get paired often. See our Langfuse alternatives and Langfuse vs LangSmith guides.
7. Fiddler AI

Fiddler AI markets itself as the AI Control Plane for the Enterprise Agent Workforce. It grew up in ML model monitoring and now covers agents under the same control plane. Fiddler offers a Developer rate of $0.002 per trace, although its pricing page directs buyers to request a demo.
Features
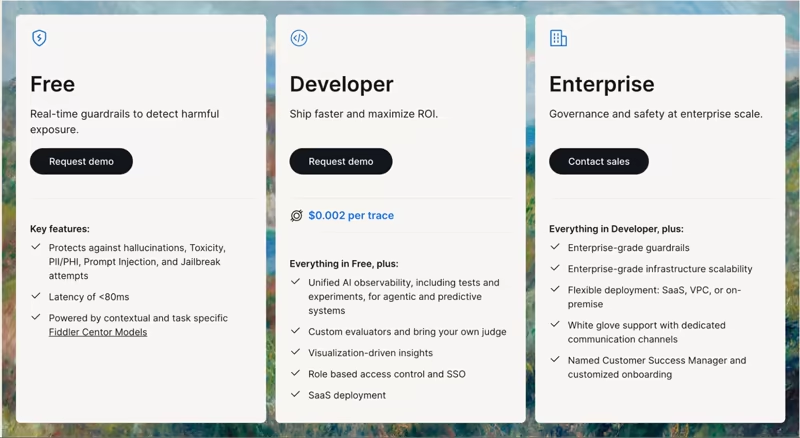
- Fiddler’s free plan includes Centor-powered checks for hallucinations, toxicity, PII/PHI, prompt injection, and jailbreak attempts with stated latency under 80 ms. You can use this when the control needs to happen before a response or action reaches the user.
- Trace agent systems through OpenTelemetry. You send OTLP from any framework with an
application.idattribute and afiddler.span.typeof chain, llm, tool, or agent. This fits teams that want to monitor multi-agent execution without adopting a framework-specific tracing format. - Score production spans with built-in Evaluator Rules, custom LLM-as-a-judge, and rule-based evaluators at a selected sample rate. Experiments accept datasets from CSV, JSONL, or DataFrames, though Fiddler’s docs do not show a direct production-trace-to-dataset button.
Pricing
Fiddler offers a generous free plan and two paid plans:
- Developer: $0.002 per trace
- Enterprise: Custom
Pros and Cons
Fiddler puts guardrails and SSO below the enterprise line. That inverts Galileo’s plan structure. The per-trace price is also the most legible meter here: 100,000 traces is $200.
The catch is fit. Fiddler is an enterprise governance product first. Its deployment docs center on Kubernetes with Helm and an AWS SageMaker partner app. There is no open-source edition or Kitaru importer.
The Best Galileo Alternatives for AI Observability and Evals
There is no one-for-one Galileo replacement because these tools solve different parts of the stack.
- Arize AX and Fiddler make the most sense if you want production observability, online evals, and enterprise controls in one platform.
- Braintrust and LangSmith fit teams that organize quality work around datasets, scorers, experiments, and CI checks.
- Langfuse and Opik are the open-source picks if you want to own the trace store and keep a hosted option available.
Several platforms here support testing changes against historical production cases. Kitaru focuses on re-executing real agent code with explicit tool policies and frozen cohorts, so you can compare a candidate change with recorded production behavior. Point it at the sessions you already have, replay last month’s real traffic against the model swap or prompt rewrite you’ve been putting off, and see what breaks before your users do.
If you would rather not run that investigation yourself, ZenML Pro hosts Kitaru for your team and adds a team of AI engineers that read every new trace next to your evals, show you what they miss, and ask you only when a session needs your call. Starter is $39 a month for one agent and your whole team, with a 14-day trial and no credit card.
Book a demo with our founding engineer to see Kitaru in action, or try it yourself: it is open source at zenml.io/product/kitaru. For the hosted version, start a free ZenML Pro trial.