
On this page
Langfuse is a popular open-source observability tool for LLM applications, but it isn’t a one-size-fits-all framework.
As your LLM application grows, you may need a different evaluation workflow, a gateway for live traffic controls, or a way to replay agent runs when testing changes.
Langfuse already supports tracing, prompt management, online and offline evaluations, OpenTelemetry ingestion, and self-hosting. The right alternative depends on the capability you need across the large language model operations (LLMOps) lifecycle.
In this article, we briefly cover why you might seek a Langfuse alternative, what criteria to consider, and then dive into 9 of the best alternatives.
Langfuse Alternatives: Quick Overview
- Why Look for Alternatives: Compare tools when you need a different evaluation workflow, live gateway controls, or agent replay. Langfuse already supports OpenTelemetry and uses ClickHouse for trace analytics, so missing OTel support and a Postgres-only architecture are not reasons to switch.
- Who Should Care: ML engineers and LLMOps teams running production apps that need secure, compliant, or self-hosted solutions capable of handling high volumes of LLM traffic.
- What to Expect: 9 options covering tracing, evaluation, and prompt workflows, including Kitaru for replay-based testing alongside an existing observability platform. Each entry covers features, pricing, and tradeoffs.
The Need for a Langfuse Alternative?
Even if Langfuse jump-started your LLM observability, as your application matures, your architectural or organizational needs might shift.
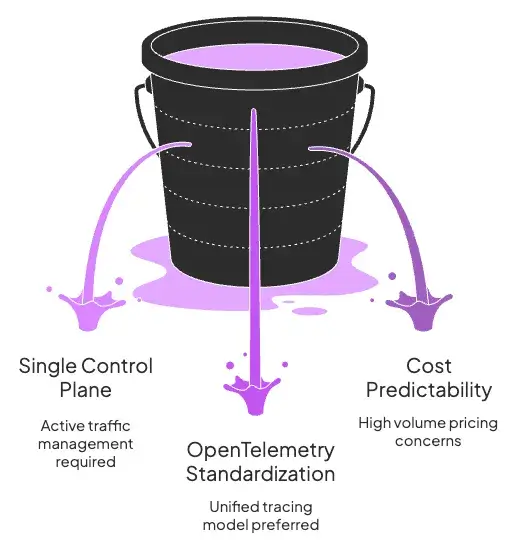
Teams may compare alternatives to consolidate live traffic controls, fit an existing telemetry workflow, or change how observability costs are metered. These are requirements to evaluate against your workload, rather than limitations shared by every Langfuse deployment.
1. Requirement for a Single Control Plane (Gateway + Guardrails)
Some engineering teams expect a single “box” that actively brokers traffic: handling routing, failover, caching, quotas, and guardrails, while simultaneously providing observability.
Langfuse combines observability, evaluation, and prompt management. Its online evaluations score production traces, while offline experiments test changes before release. If you also need request routing, provider failover, or rate limits, compare gateway capabilities separately from tracing and evaluation.
- The Driver: Teams often need multi-provider failover, traffic shaping, and runtime policy enforcement in one unified layer.
- The Reality: If you need a control plane at the edge, you are looking for a "true gateway" (like Portkey or Helicone) or a unified platform that includes gateway capabilities, rather than just a passive observer.
2. Standardization on OpenTelemetry (OTel)
Langfuse accepts OpenTelemetry traces through its OTLP endpoint and can ingest spans from an existing collector. You do not need to abandon OTel to use it.
The practical question is where your team wants to investigate failures. A general-purpose telemetry backend may suit teams that need to correlate LLM calls with the rest of their services in one interface. An LLM-focused platform can offer more specialized prompt, dataset, and evaluation workflows. Compare attribute mapping and trace propagation using your own application.
3. Cost Predictability at High Volume
Compare the billable unit, included usage, retention, and overage rate before assuming one platform is cheaper. A request can generate several trace observations and evaluation scores; model token spend is a separate cost.
Langfuse Cloud currently offers Hobby with 50,000 units per month, Core at $29 per month, and Pro at $199 per month. Core and Pro include 100,000 units, with graduated charges for additional usage.
Self-hosting changes the cost model but does not make it fixed: infrastructure, storage, backups, upgrades, and engineering time still grow with the workload. Estimate those costs alongside the hosted subscription.
Evaluation Criteria
When evaluating Langfuse alternatives, we prioritized the following criteria:
- Deployment and Data Residency: Can you self-host or run the tool on-premises? Does it accommodate your data governance needs? Tools that offer open-source editions or flexible hosting got bonus points.
- Security, Compliance, and Privacy: Enterprise teams require SOC 2 compliance, encryption, and role-based access control. We looked at whether each platform supports SSO/SAML, audit logs, and isolation of sensitive data.
- Instrumentation and Integrations: How easily does the tool integrate with your LLM stack? We checked for OpenTelemetry support, SDKs in multiple languages, and native integrations with frameworks like LangChain or LlamaIndex. Minimal code changes for logging are a plus.
- Data Model and Queryability: Does the platform simply store unstructured logs, or does it provide a queryable store for traces and prompt metadata? We favored tools that make it easy to search, filter traces, and support advanced analytics or custom dashboards on top of the data.
With these criteria in mind, let’s examine the top Langfuse alternatives for LLM observability.
What are the Top Alternatives to Langfuse
Here’s a quick table comparing the best Langfuse alternatives:
| Langfuse Alternatives | Best For | Key Features | Pricing |
|---|---|---|---|
| Kitaru | Replay-based regression testing alongside existing tracing | Trace imports; real-code replay; cohorts and experiments | Free self-hosted; Cloud $39/month; Enterprise custom |
| LangSmith | Agent tracing, evaluations, and deployment | Framework integrations; online/offline evals; LLM Gateway public beta | Developer $0 seat fee plus usage; Plus $39/seat/month plus usage |
| HoneyHive | Production feedback and evaluation workflows | OTel tracing; asynchronous evaluations; datasets and prompt Playground | Free Developer; Enterprise custom |
| Braintrust | Production discovery and systematic evaluation | Traces and experiments; Loop, Topics, and Patterns | Starter $0 platform fee plus usage; Pro $249/month plus usage |
| Arize Phoenix | Tracing, experiments, and prompt iteration | OTel/OpenInference; datasets and evals; prompt versioning | Free self-hosted under ELv2; free Phoenix Cloud option; AX priced separately |
| Galileo | Agent evaluation and runtime policy controls | Agent tracing; evaluators; Signals and Agent Control | Free; Pro $100/month billed yearly; Enterprise custom |
| PromptLayer | Prompt collaboration and visual workflows | Prompt Registry; evaluation tables; OTLP traces; Workflows | Free; Pro $49/month plus overages; Team $500/month plus overages |
| Confident AI | DeepEval tests with hosted production review | Agent and multi-turn evaluation; traces; regression checks | Free cloud tier; Starter $200/month plus usage; Team $2,000/month plus usage |
| Opik | Open-source tracing and behavioral regression tests | Test Suites; datasets and experiments; cost tracking | Free self-hosted; Free Cloud; Pro Cloud $19/month plus paid usage or retention expansions |
1. Kitaru
Best for: Teams that want to test agent changes against real production sessions while keeping their existing observability platform.
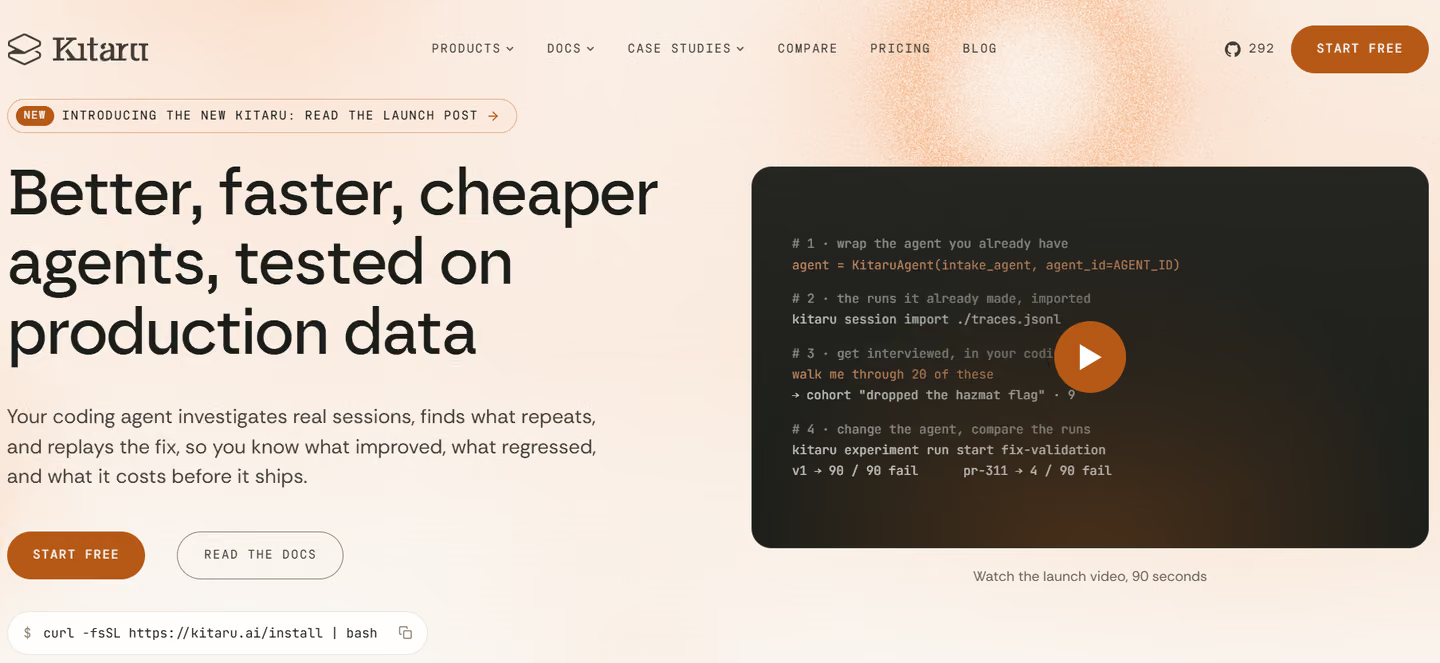
Kitaru is an open-source platform for replay-based agent evaluations from the team behind ZenML. It imports existing traces or records new sessions, then runs your agent’s code again to test how a different prompt, model, or implementation changes its behavior.
Kitaru can sit alongside Langfuse: keep Langfuse for production tracing and use Kitaru to turn recorded failures into regression tests. It belongs on this list when you’re comparing alternatives to improve evaluation. It does not replace Langfuse’s live tracing and prompt management.
Features
- Import production history: Bring in exported traces from Langfuse, LangSmith, Braintrust, Logfire, and Arize Phoenix to inspect sessions and build evaluation sets.
- Replay real agent code: Test model, prompt, or code changes from the start of an agent run. Supported tool policies can return recorded outputs, fixed test responses, or live results.
- Compare a consistent set of cases: Versioned cohorts hold the test population steady while experiments compare baseline and candidate scores, costs, and token totals.
- Define your own checks: Python evaluators inspect a session and return scores or pass/fail results. Apply the same criteria to imported history and new replays.
- Use supported framework adapters: Recording integrations cover PydanticAI, LangGraph, OpenAI Agents, Mastra, and Vercel AI SDK; replay capabilities vary by adapter.
Pricing
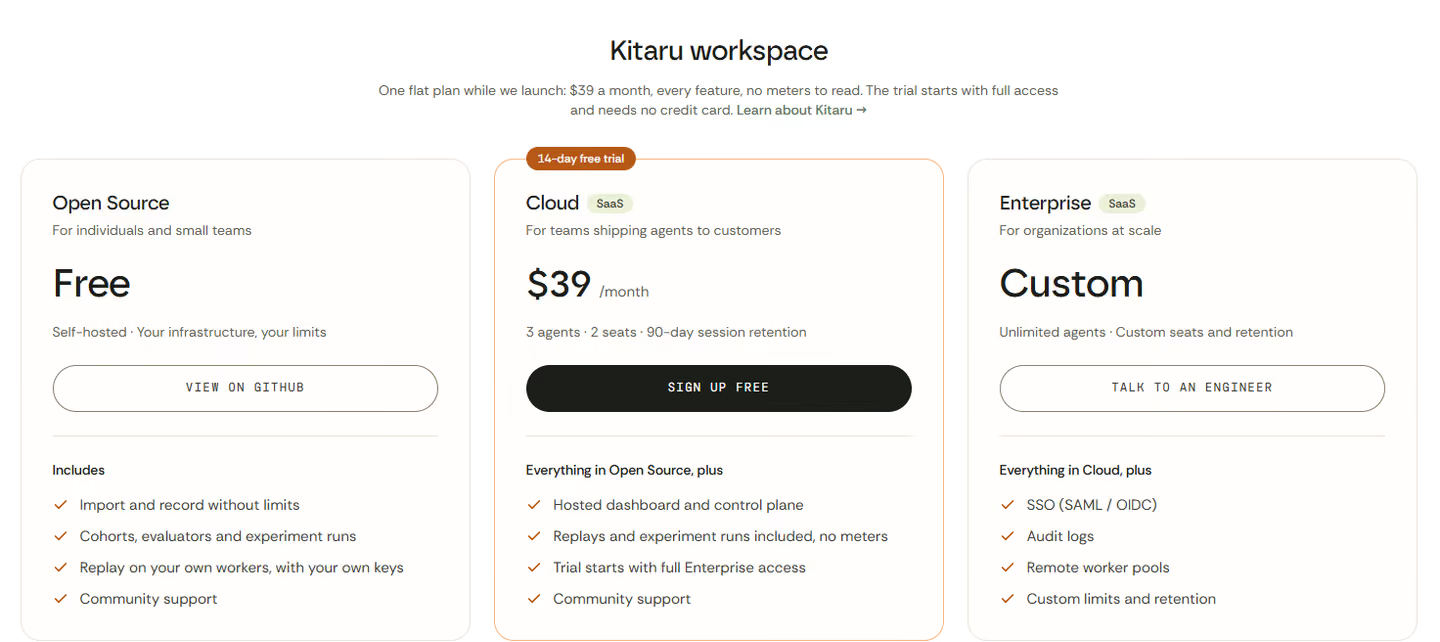
Kitaru is free to self-host under Apache 2.0. Cloud costs $39 per month and includes 3 agents, 2 seats, 90-day session retention, and replay and experiment runs without platform usage meters. A 14-day trial is available. Enterprise pricing is custom. Model-provider charges and worker infrastructure costs remain separate.
Pros and Cons
Kitaru is useful when you have a production failure and want to test whether a proposed change fixes it across a repeatable set of cases. Keeping the existing tracing platform also reduces the scope of migration.
Replay requires runnable agent code and a compatible adapter; a trace export alone is not enough. Configure tool policies explicitly. Where history replay is supported, use a fail-on-missing policy to stop when a recorded result is unavailable. An unspecified policy can call live tools, so recorded traces alone do not make a replay isolated.
2. LangSmith
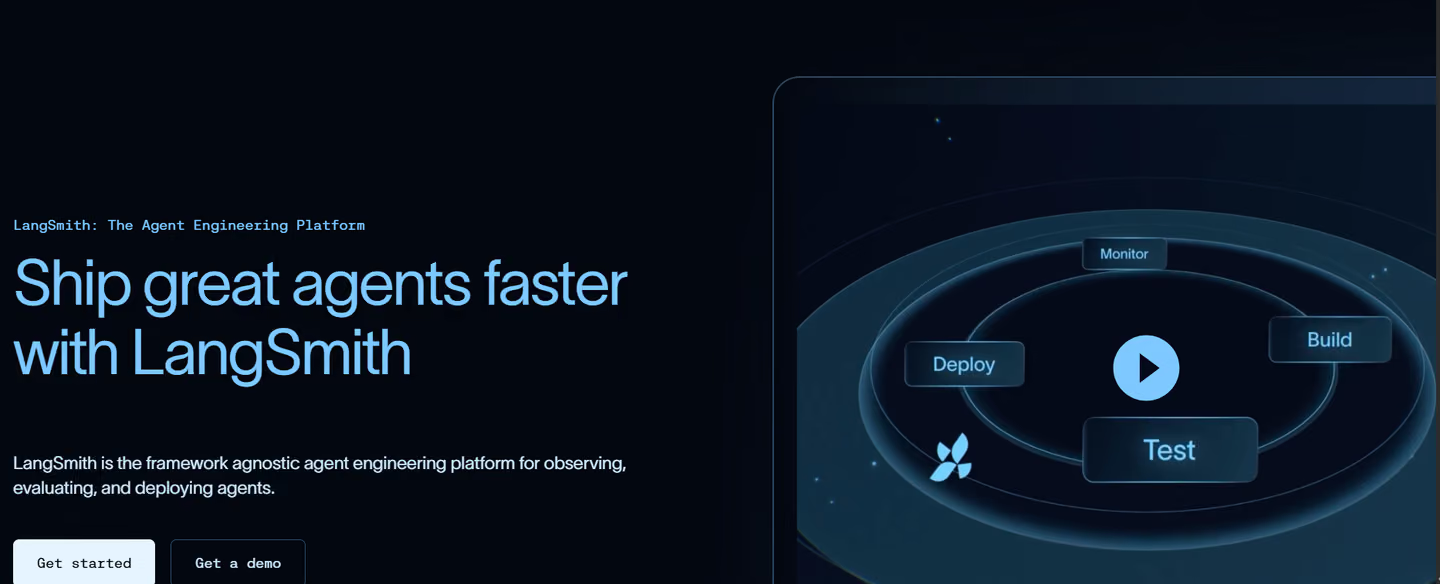
LangSmith is LangChain’s platform for tracing, evaluating, and deploying AI applications. It integrates with LangChain and LangGraph as well as frameworks and SDKs such as OpenAI, Anthropic, CrewAI, Vercel AI SDK, and Pydantic AI. Its traces show recorded model calls, tool activity, inputs, and outputs so teams can investigate failures.
Features
- Log every LLM call and visualize nested chains with token usage, latency, and intermediate outputs to pinpoint failures.
- Test prompts instantly in the playground and track live metrics like latency, cost, and errors with real-time alerts in custom dashboards.
- Run online evaluations on production traces and offline evaluations against datasets, with annotation queues for human feedback.
- Integrate with LangChain or OpenTelemetry to centralize logs across multiple frameworks with minimal setup.
- Use LangSmith LLM Gateway to set spending and rate limits and route requests to fallback models. It is in public beta and included with Plus and Enterprise during beta; PII and secrets redaction requires Enterprise.
- Collaborate through shared trace links and in-app comments; self-host via enterprise Kubernetes deployment for full data control.
Pricing
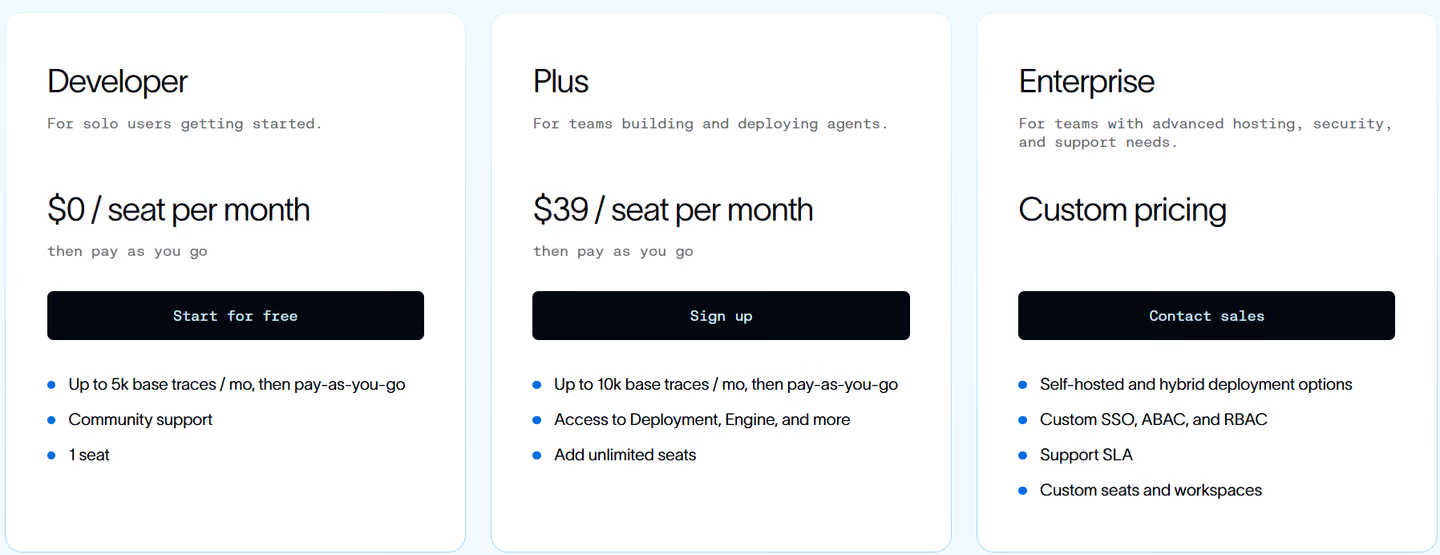
LangSmith’s Developer plan has no seat fee and includes one user and 5,000 base traces per month. Plus costs $39 per seat per month and includes 10,000 base traces per month, with additional usage charges. Enterprise has custom pricing and hybrid or self-hosted options. Base traces have 14-day retention. New extended SaaS traces have up to 180-day retention from September 14, 2026; Enterprise can configure a shorter period. Check usage and retention settings when estimating the bill.
Pros and Cons
LangSmith’s biggest strength is its deep LangChain integration. It makes debugging intuitive for LangChain or LangGraph apps. Its combined observability and evaluation tools simplify quality tracking, offering clear dashboards, metrics, and insights in one place.
Budget for seats and usage separately. Teams that need the platform on their own infrastructure must evaluate the custom-priced Enterprise deployment options. Gateway and deployment services can consolidate workflows, but should be evaluated independently of basic tracing.
📚 Also read: Langfuse vs LangSmith
3. HoneyHive

HoneyHive is a proprietary, full-lifecycle platform for LLM development. Think of it as a modern AI observability platform that emphasizes both monitoring and evaluation.
Features
- Use OpenTelemetry-based instrumentation to record prompts, model responses, and tool calls. Check field mapping and export requirements when planning a migration.
- Monitor LLM metrics in real-time dashboards with filters for latency, token cost, and request volume by model or user segment.
- Evaluate outputs with Python checks, LLM judges, and human review. Client-side evaluators run in your application; server-side evaluators score matching traces asynchronously after ingestion.
- Curate datasets directly from production logs by collecting, labeling, and converting edge cases into eval or fine-tuning sets.
- Connect with LangChain, RAG pipelines, and vector stores like Pinecone to trace every component of your LLM workflow.
- Test prompt templates and model settings in the Playground, including multi-turn conversations. Fork a working prompt before experimenting: saving changes to an existing configuration overwrites that configuration.
Pricing
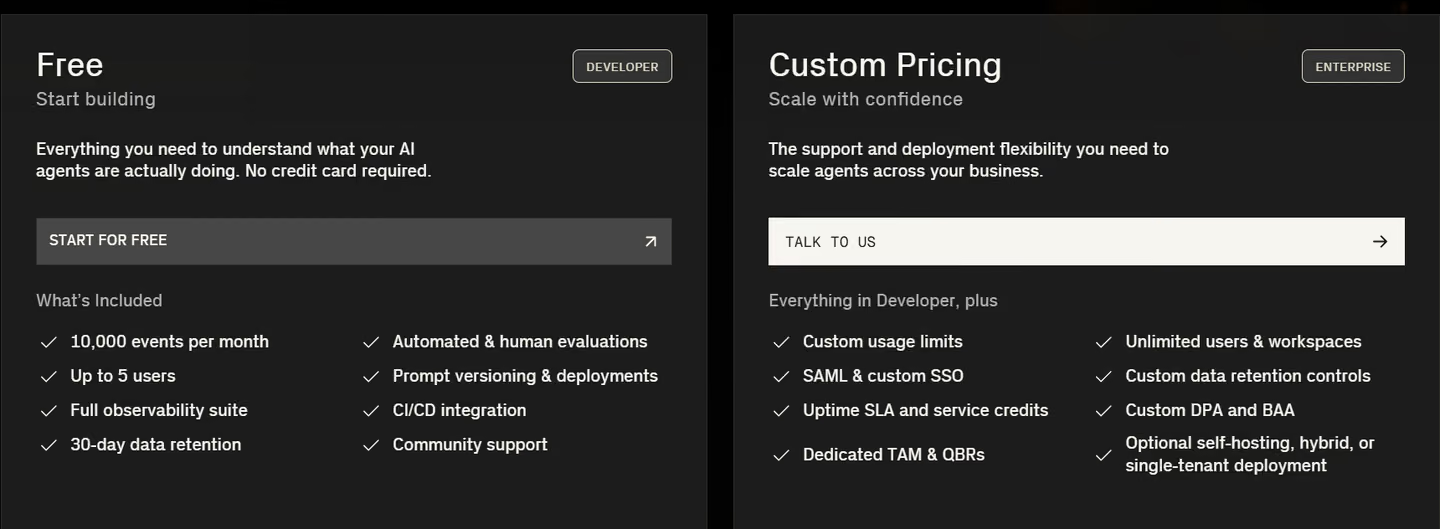
HoneyHive’s free Developer plan includes 10,000 events per month, up to five users, and 30-day retention. An event is a trace span or a metric-label combination, so this is not an allowance of 10,000 complete agent requests. Enterprise has custom pricing and usage limits, with self-hosted, hybrid, and single-tenant options.
Pros and Cons
HoneyHive’s agent-centric design and dedicated focus on the dev-prod feedback mechanism make it highly effective for teams constructing sophisticated agentic systems. Its OTLP compatibility ensures flexibility across various frameworks.
The limitation is that it remains primarily a proprietary SaaS platform, with self-hosting and the most necessary governance features restricted to the custom-priced Enterprise tiers.
4. Braintrust
Braintrust combines production tracing, evaluation datasets, experiments, and tools for investigating agent behavior. Its Brainstore database supports searching and filtering traces, while discovery features help turn production failures into evaluation cases and monitoring checks.
Features
- Request-level tracing with spans and sub-spans (inputs/outputs, metadata, metrics, scores) for online logs and offline eval runs.
- Fast trace exploration and diffing: search/filter millions of spans, view trees, bulk-select to datasets, and diff traces across experiments for A/B comparisons.
- Autoevals library with LLM-as-judge, heuristic, and statistical metrics; supports custom scorers and RAG-style checks.
- Datasets and experiments workflow: log production traffic or curated sets, run evaluations, compare experiment results, and promote winners.
- Investigate production behavior with Loop, group traces into Topics, and use Patterns to surface recurring issues. Turn useful findings into regression datasets, scorers, and monitoring checks.
Pricing
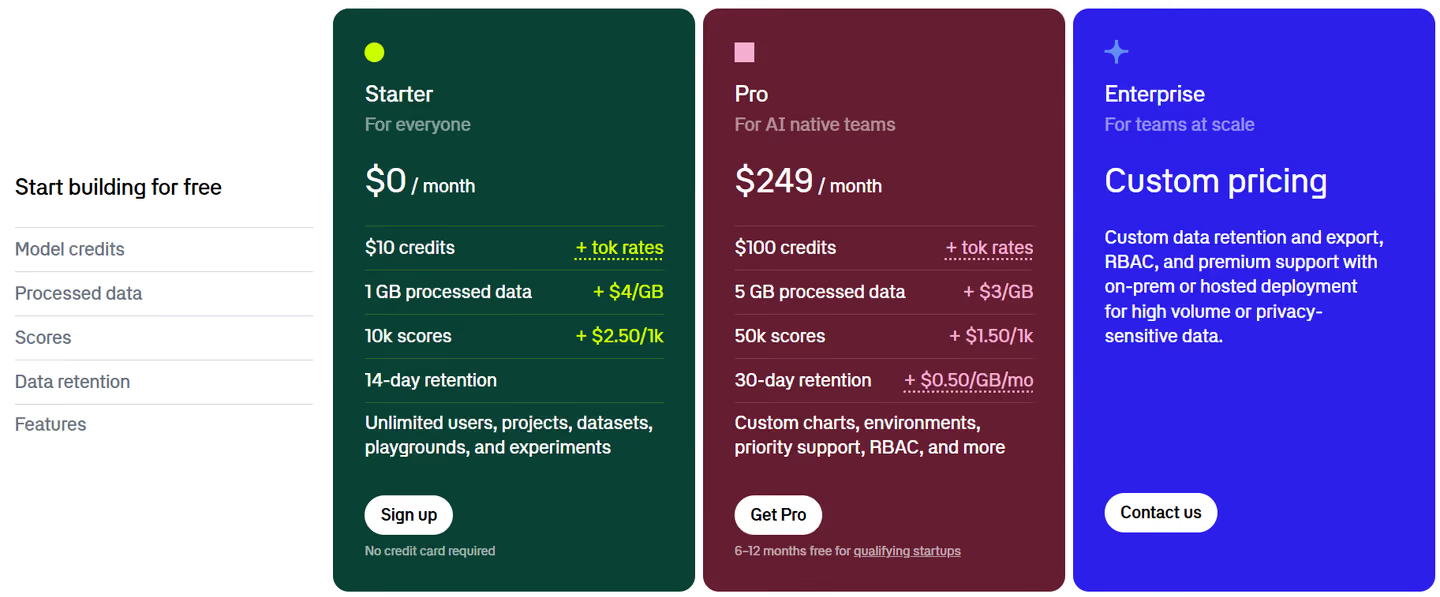
Braintrust’s Starter plan has a $0 monthly platform fee and includes 1 GB of processed data, 10,000 scores, $10 in model credits, and 14-day retention. With on-demand usage enabled, additional data costs $4/GB and additional scores cost $2.50 per 1,000.
Pro costs $249 per month, including 5 GB of processed data, 50,000 scores, $100 in model credits, and 30-day retention. Pro overages are $3/GB and $1.50 per 1,000 scores; extended retention is $0.50/GB/month after the included period. Enterprise is custom-priced. Model usage beyond included credits is charged separately.
Pros and Cons
Braintrust connects production investigation with systematic evaluation. Teams can collect difficult cases from traces, compare changes across datasets, and reuse the results in their quality checks.
The core drawback is Braintrust’s pricing structure. Its premium price deters smaller teams. The pay-per-use model for evaluation scores becomes expensive as testing frequency and the evaluation datasets expand. Furthermore, self-hosting remains inaccessible outside the Enterprise tier.
5. Arize Phoenix
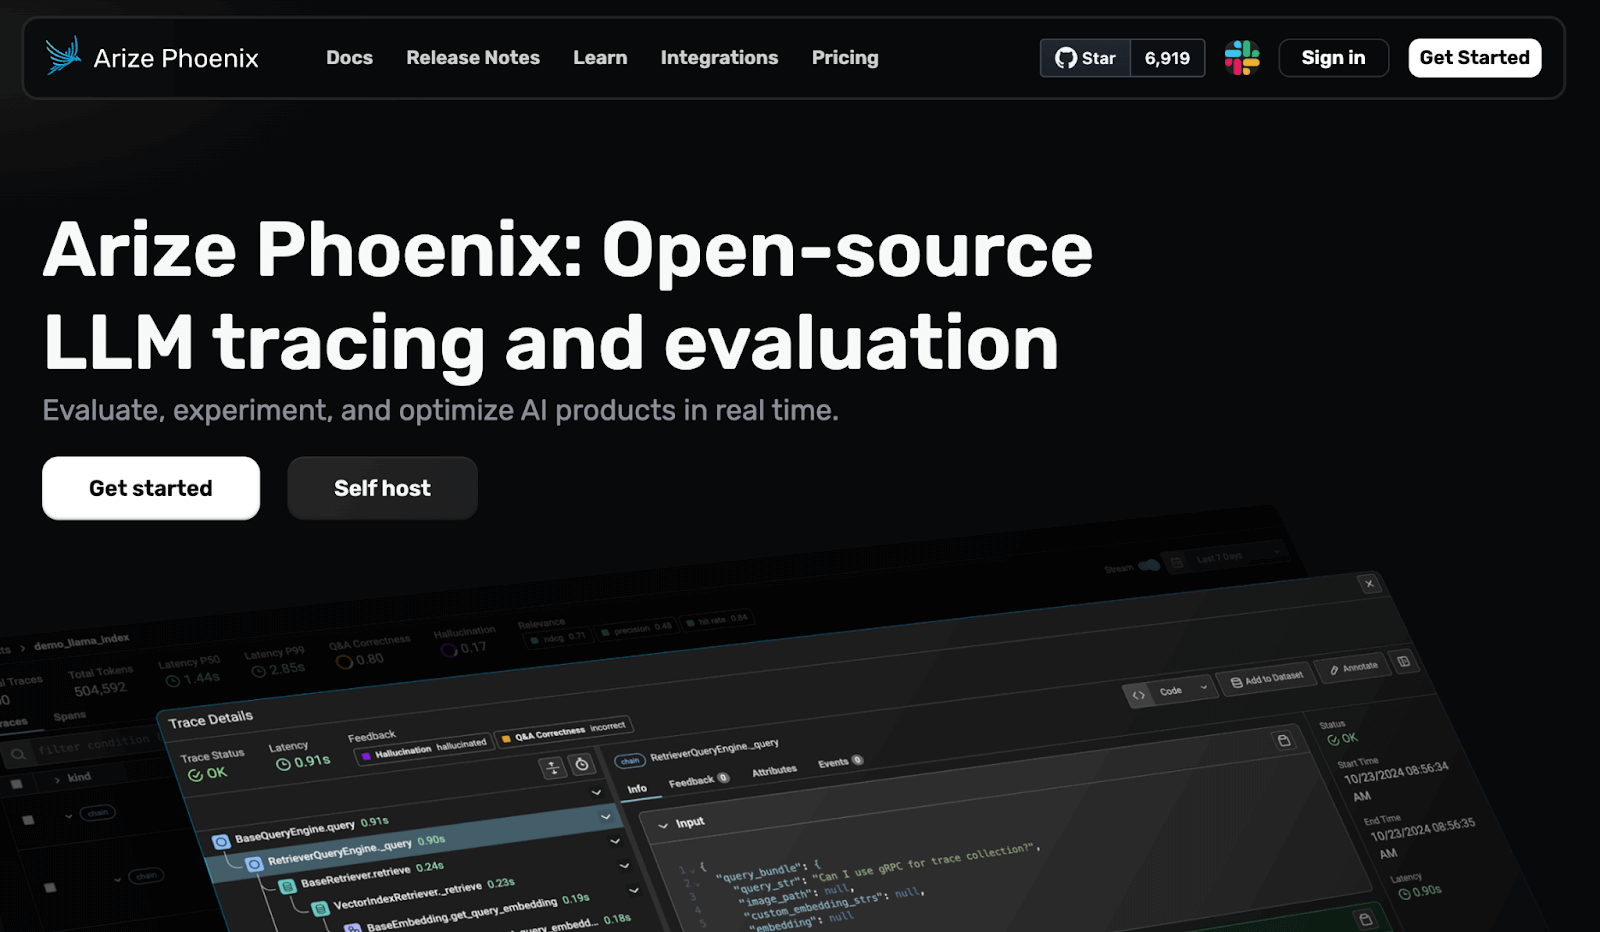
Phoenix is Arize’s platform for tracing, evaluating, and iterating on AI applications. It supports OpenTelemetry and OpenInference instrumentation, datasets, experiments, and prompt management. Run it locally, self-host it, or use Phoenix Cloud. Arize AX is a separate managed platform.
Features
- Capture model calls, retrieval, tool use, and application logic through OpenTelemetry and OpenInference integrations.
- Score traces and spans with Phoenix evaluators, custom code, or human annotations; bring evaluators from Ragas, DeepEval, or Cleanlab when needed.
- Build datasets from traces and compare application variants in experiments.
- Version prompts, compare models in the playground, and replay individual LLM calls with changed inputs.
Pricing
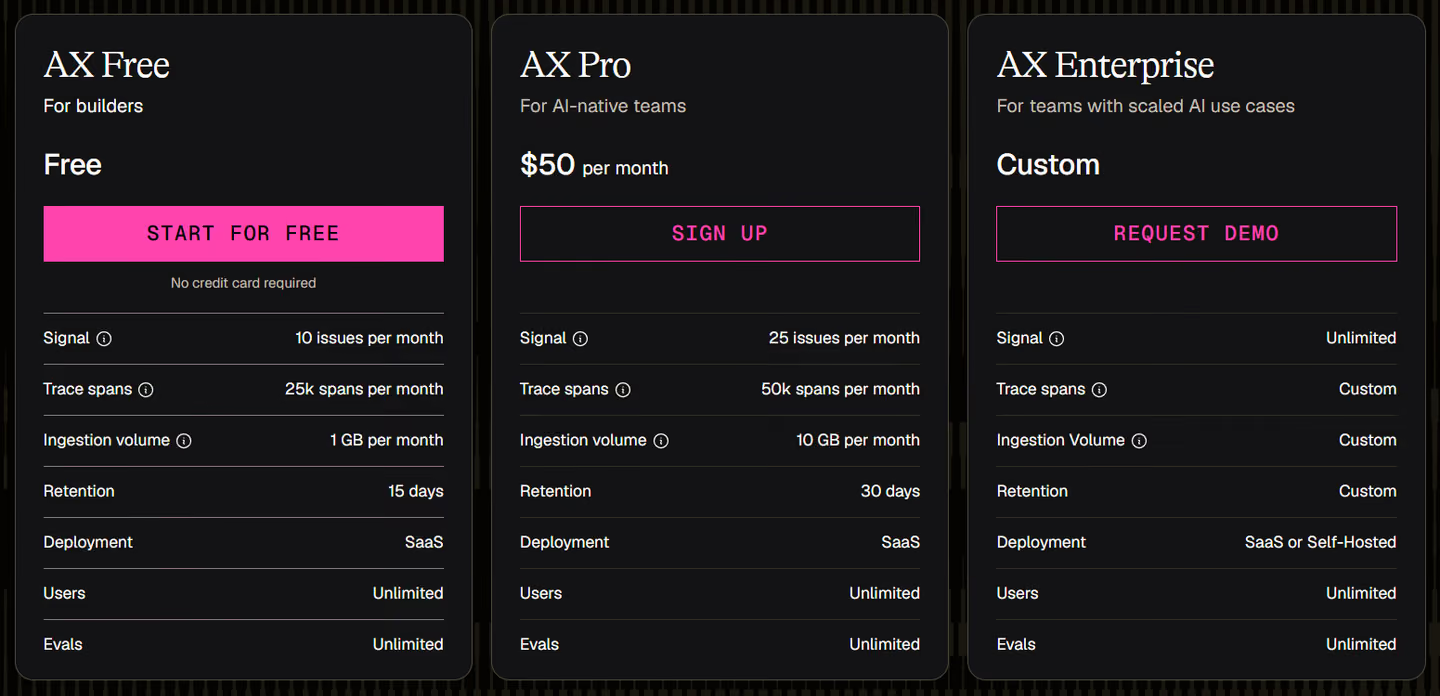
Phoenix is free to self-host under the Elastic License 2.0; your team pays its infrastructure and model-provider costs. Phoenix Cloud also offers a free starting option. Arize AX is a separate product with Free, Pro starting at $50 per month, and custom Enterprise plans. Compare its allowances and retention separately rather than treating AX as a Phoenix paid tier.
Pros and Cons
Phoenix offers deployment choice alongside tracing, experiments, and prompt iteration. Its self-hosted edition has no feature gates, while Phoenix Cloud offers a way to start without managing a server.
Self-hosting leaves storage, upgrades, and capacity with your team. The ELv2 license restricts offering the software as a competing hosted service. Evaluate Phoenix and Arize AX separately when comparing managed operations and enterprise support.
6. Galileo
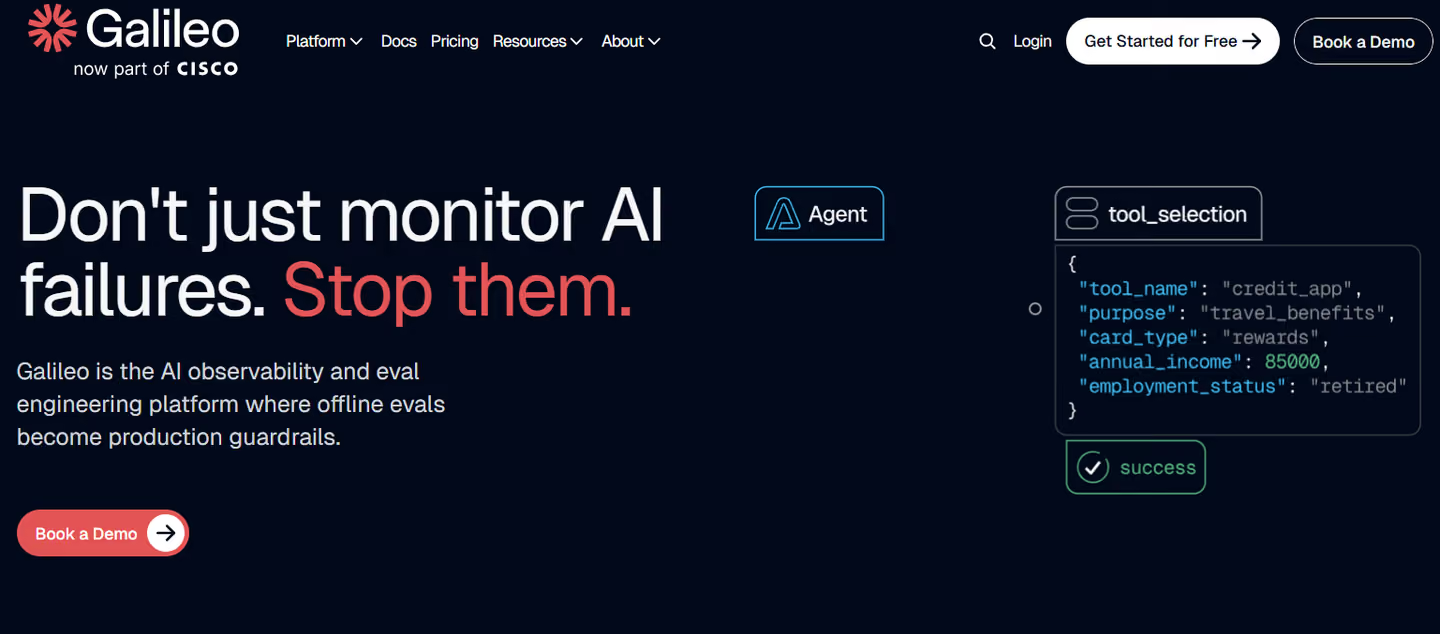
Galileo combines agent observability, evaluation, and runtime controls. It is worth considering when teams need to investigate recurring failures and apply policies to agent or tool activity. Compare the commercial plan and deployment requirements for each capability.
Features
- Track every agent step and tool call to make complex LLM workflows transparent and fully debuggable.
- Use built-in evaluators and custom metrics to assess agent quality, and validate their scores against examples labeled by your team.
- Use Agent Control to apply reusable policies to LLM and tool inputs and outputs during execution, including checks for prompt injection and PII leakage.
- Use standard RBAC on Pro; compare Enterprise for SSO, enterprise access controls, and VPC or on-premises deployment.
- Review agent runs with human annotations and compare experiment results when testing changes.
- Galileo Signals groups related problems across production traces and lets teams turn a discovered pattern into an LLM-as-a-judge metric. For recurring tool errors or policy drift, this can help build evaluation checks around failures your existing metrics miss.
Pricing
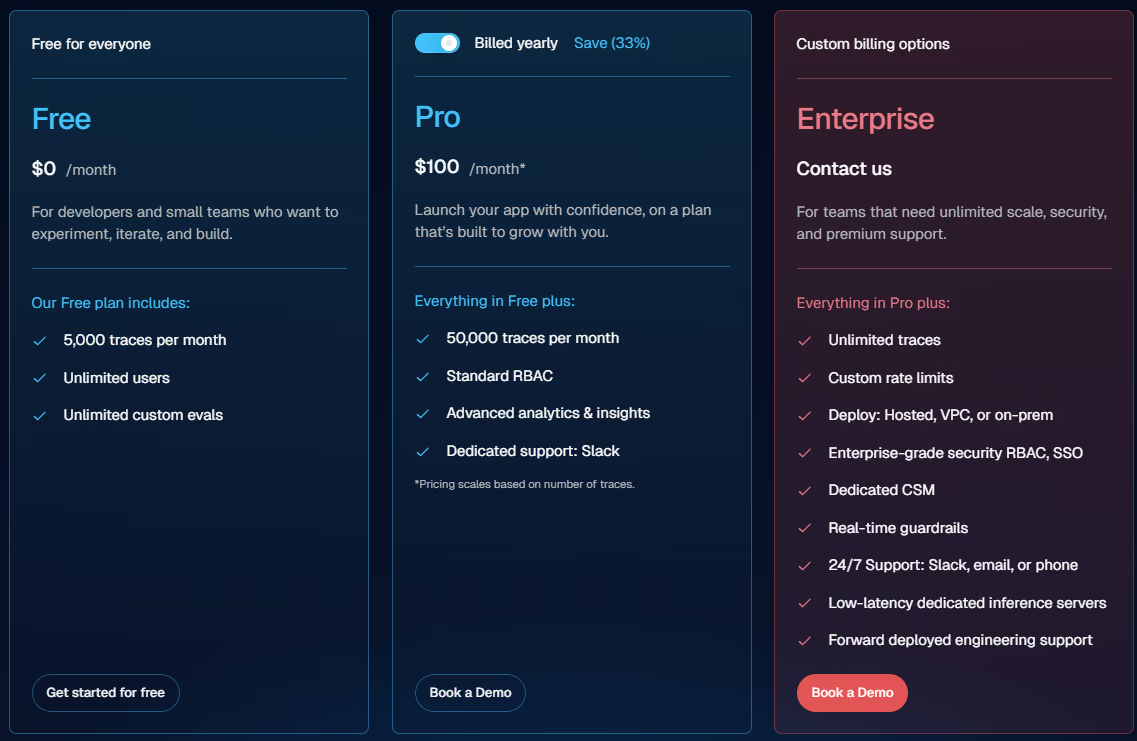
Galileo’s Free plan includes 5,000 traces per month, unlimited users, and unlimited custom evaluations. Pro is listed at $100 per month billed yearly, with 50,000 traces per month; pricing scales with trace volume. Enterprise is custom-priced and includes enterprise security, VPC or on-premises deployment, and real-time guardrails.
Pros and Cons
Galileo combines quality evaluation with investigation and runtime policy controls. That can help teams connect a recurring production failure to a check they can monitor or enforce.
Evaluate the cost and deployment requirements of the features you need. The commercial pricing page places enterprise security, VPC/on-premises deployment, and real-time guardrails in its custom Enterprise offering. Validate evaluation models against your own examples before using their scores to govern production behavior.
7. PromptLayer
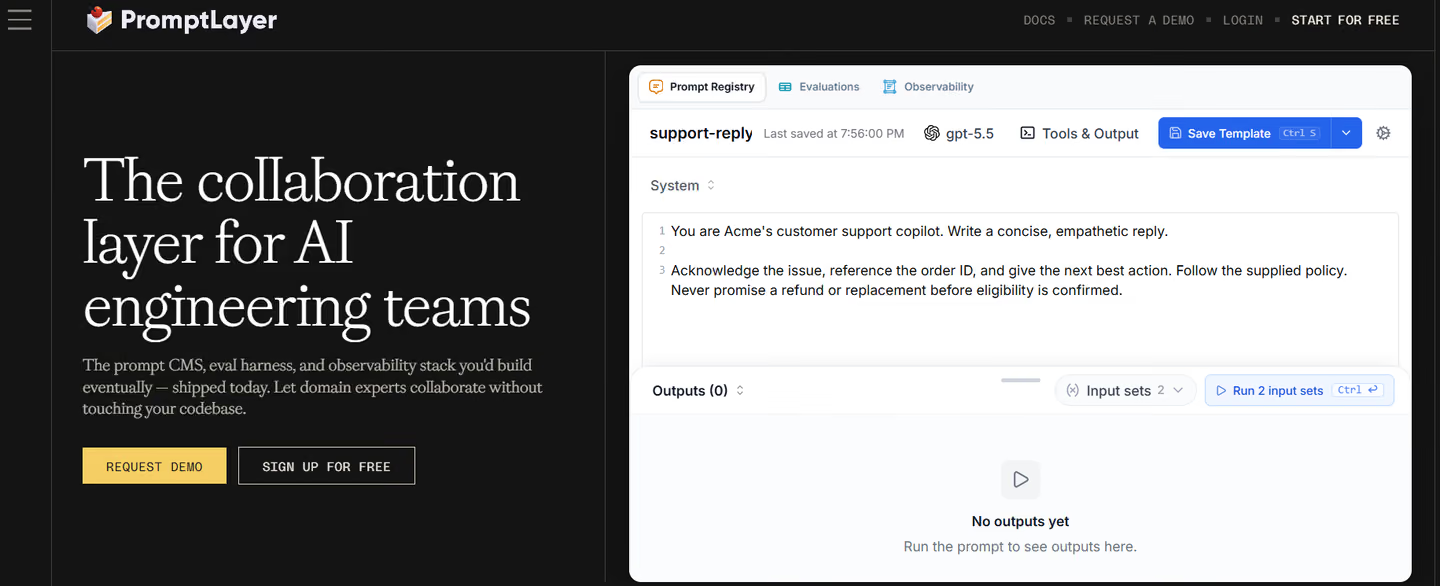
PromptLayer started as a way to log and version OpenAI API calls, and has since grown into a broader platform with prompt observability, version control, A/B testing, and even a visual workflow builder. It combines a versioned Prompt Registry with evaluation tables, production tracing, and visual workflows for multi-step applications.
Features
- Record every LLM prompt through API wrappers and store them in a central Prompt Registry with full version history.
- Analyze prompt performance in real time using dashboards that track latency, cost, error rate, and usage trends.
- Run A/B tests or regression evaluations to compare prompt or model variants and detect regressions early.
- Build versioned visual Workflows with LLM calls, external API calls, loops, and conditional branches, then inspect the trace and intermediate outputs for each node.
- Send existing OpenTelemetry spans over OTLP/HTTP and link LLM traces to specific prompt names and versions.
Pricing
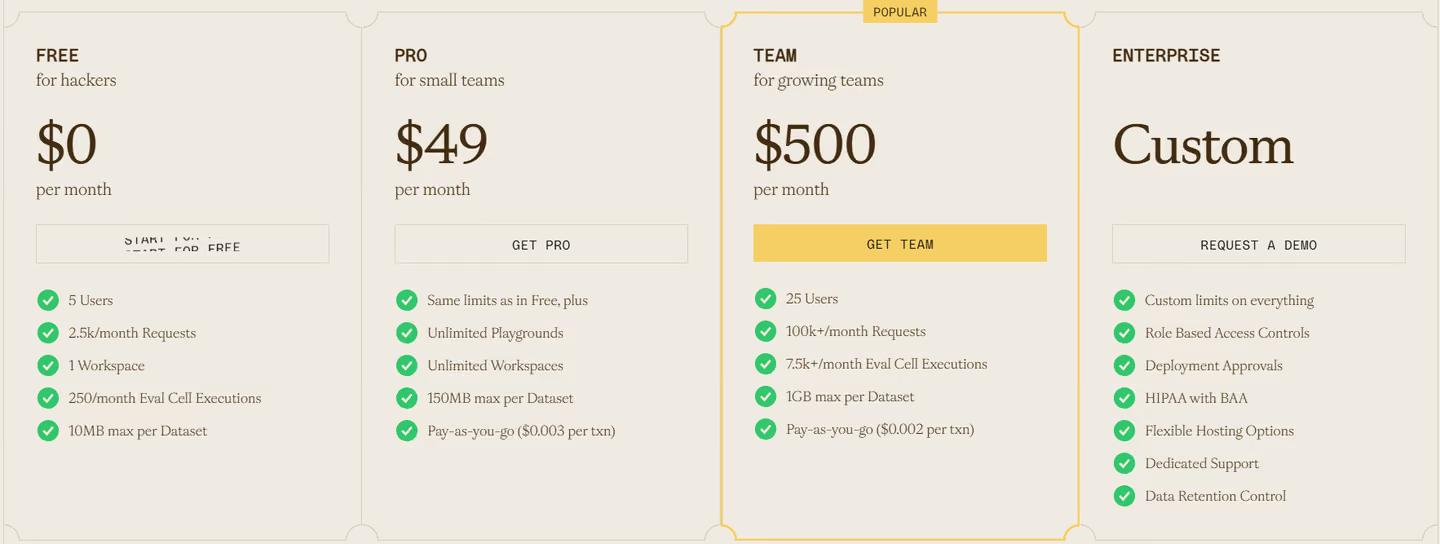
PromptLayer’s Free plan includes five users, 2,500 requests per month, and 250 evaluation-cell executions per month. Pro costs $49 per month, includes five users and the Free plan’s request and evaluation allowances, and charges $0.003 per additional transaction. Team costs $500 per month with 25 users, 100,000 requests, and 7,500 evaluation-cell executions per month; overages cost $0.002 per transaction. Enterprise is custom-priced. Requests, agent runs, and evaluation-cell runs can contribute to transaction charges.
Pros and Cons
PromptLayer is purpose-built for prompt engineering. It’s ideal for both engineers and non-technical collaborators. Features like A/B testing, an agent builder, and API integrations make it a strong choice for teams focused on optimizing prompt quality and iteration speed.
PromptLayer accepts standard OpenTelemetry traces without requiring its SDK. Compare expected request, workflow, and evaluation usage before choosing a plan; self-hosting and advanced deployment controls require Enterprise. Evaluate its workflow capabilities against your application instead of assuming a prompt-focused product cannot support multi-step agents.
8. Confident AI
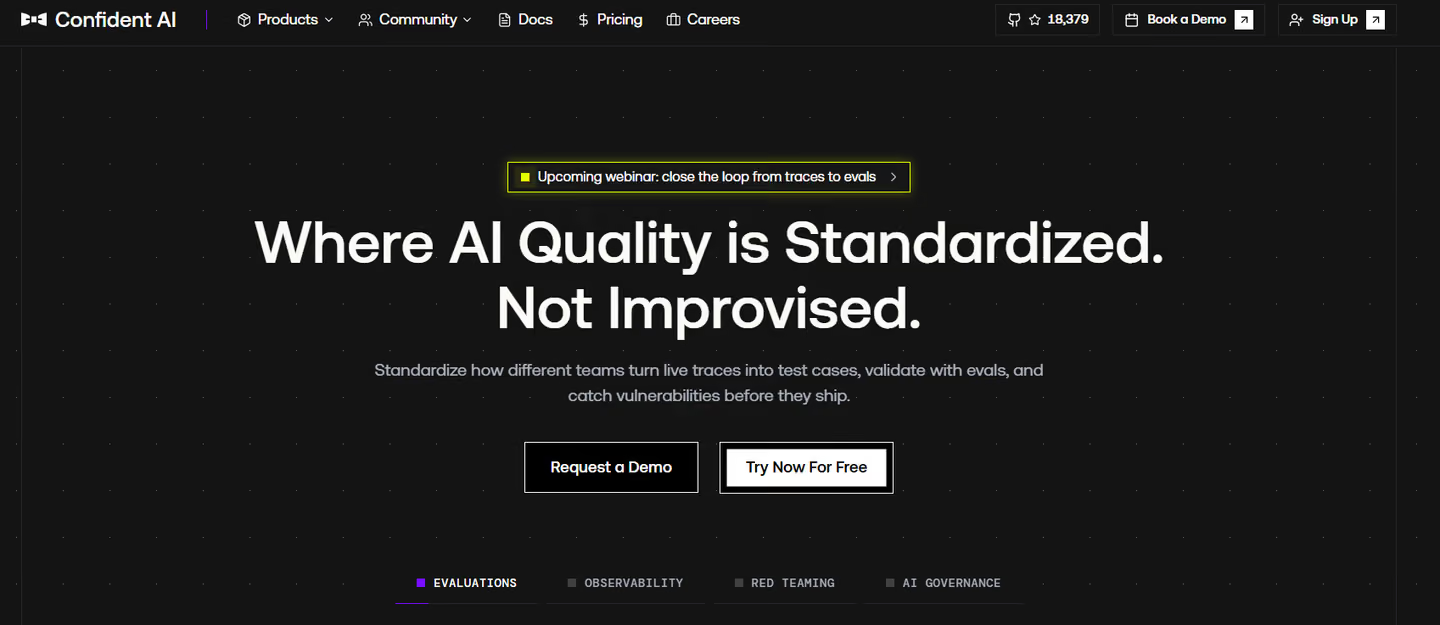
Confident AI is a dedicated cloud platform built on top of the open-source DeepEval framework. If you’re looking for a Langfuse alternative that emphasizes robust evaluation and QA of LLMs, Confident AI is a strong contender.
Features
- Test outputs and agent behavior with DeepEval metrics for task completion, step efficiency, tool correctness, and conversation completeness, or define custom checks.
- Compare prompt or application versions with regression tests; use multi-turn evaluation to detect forgotten context or incomplete user goals across a conversation.
- Enable one-line tracing in LangChain, LlamaIndex, or custom pipelines to capture the complete prompt, retrieval, and response context.
- Monitor live LLM responses and set alerts for latency spikes or failed quality checks to ensure consistent model performance.
- Collect user feedback and convert it into evaluation labels for continuous prompt, model, and metric refinement.
- For agent evaluation, distinguish the final answer from the path used to obtain it. DeepEval can evaluate an ordered trace for task completion and efficiency, then score individual LLM spans for tool-selection mistakes. Development checks and production evaluations have different execution requirements; decide which checks belong in CI and which should score recorded production activity.
Pricing
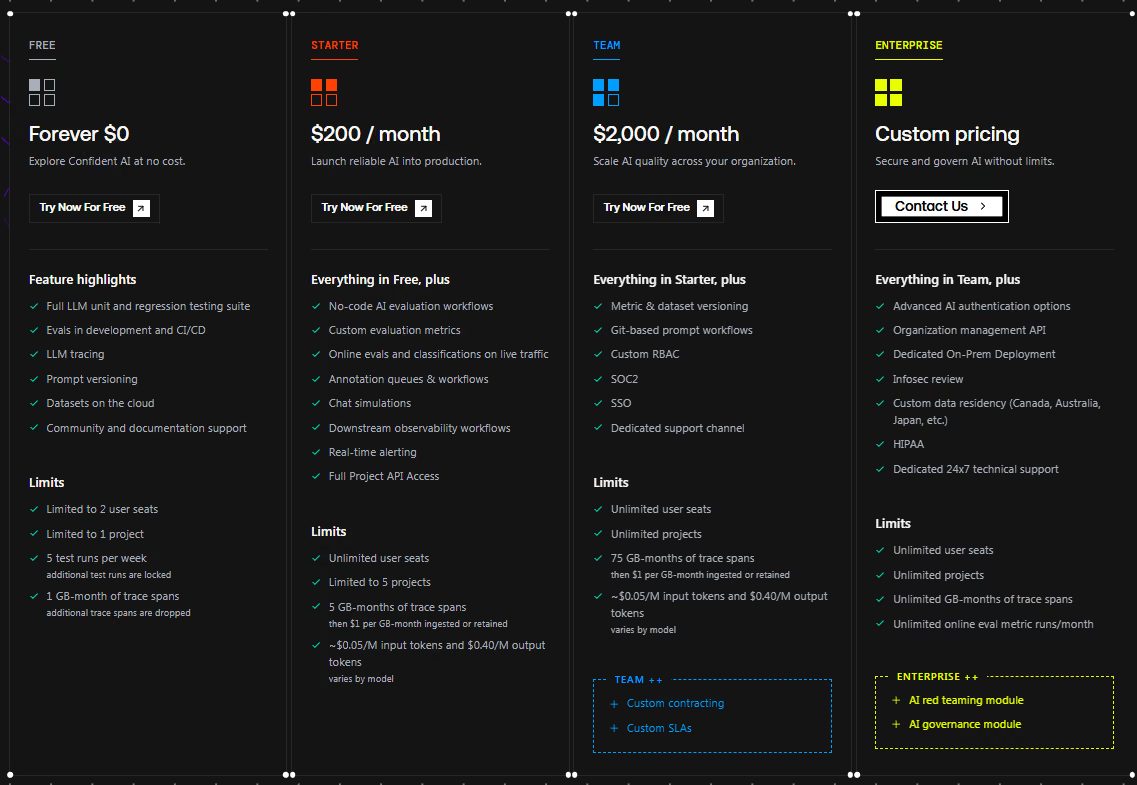
DeepEval is the open-source evaluation framework; Confident AI is its hosted platform. Confident AI’s Free plan includes two seats, one project, five test runs per week, and 1 GB-month of trace spans. Starter costs $200 per month with unlimited seats, five projects, and 5 GB-months. Team costs $2,000 per month with unlimited seats and projects and 75 GB-months. Both paid plans list additional trace usage at $1 per GB-month ingested or retained; model-based evaluation charges also apply. Enterprise has custom pricing.
Pros and Cons
DeepEval fits teams that want evaluation logic in code and regression checks in development or CI. Confident AI adds shared datasets, production tracing, online evaluations, and review workflows.
The paid platform starts at $200 per month. Teams that mainly need local tests should compare DeepEval alone with the collaboration and production capabilities they would use in Confident AI.
9. Opik
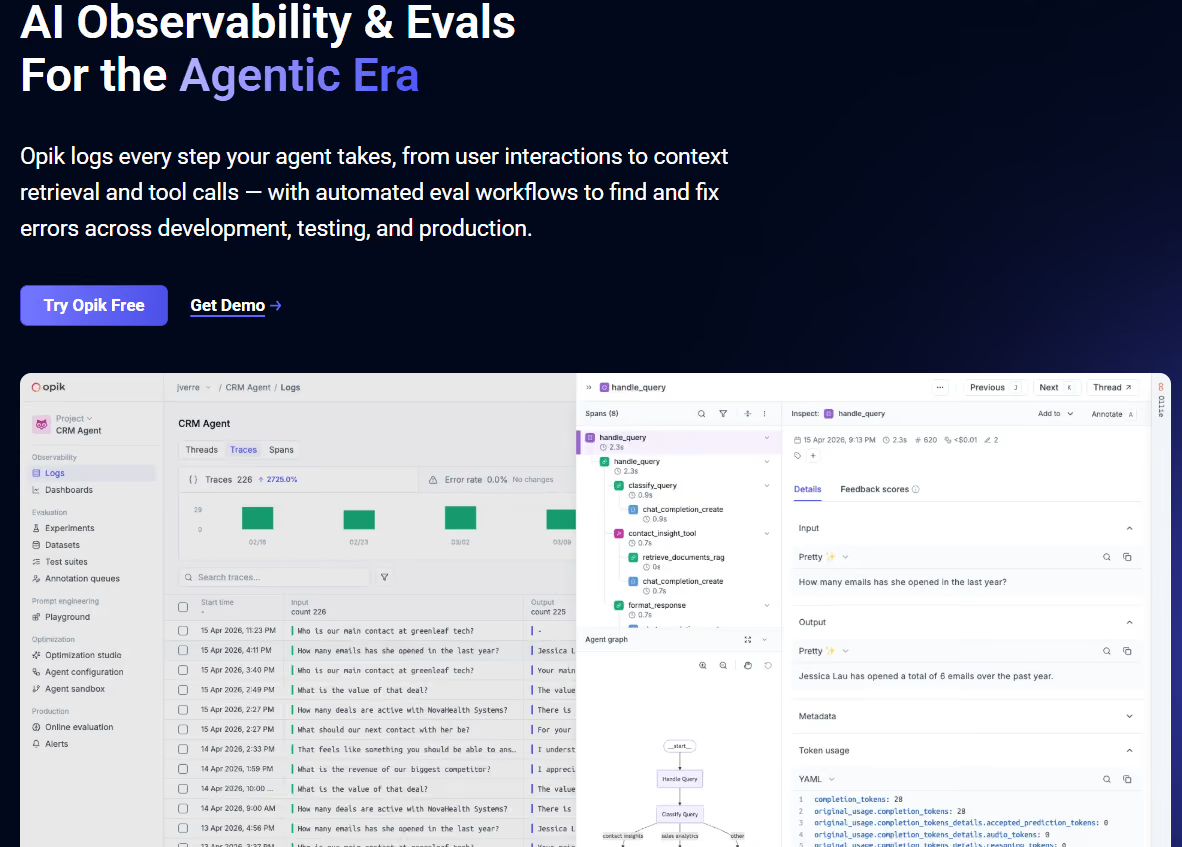
Opik is Comet’s platform for debugging, evaluating, and monitoring LLM applications and agents. It combines production traces, offline tests, and experiment comparisons, making it a direct option for teams considering a move from Langfuse.
Features
- Behavioral Test Suites. Express expected behavior as natural-language assertions and use LLM judges for pass/fail results. Repeat runs and set a passing threshold to account for variable model outputs.
- Turn failures into tests. Add production traces to a test suite through the UI, SDK, or Ollie assistant, then define what the agent should have done.
- Dataset evaluations. Use built-in or custom metrics to compare prompt and model variants; add human review through annotation queues.
- Cost tracking. Inspect estimated model costs at span, trace, and project level alongside quality results.
Pricing
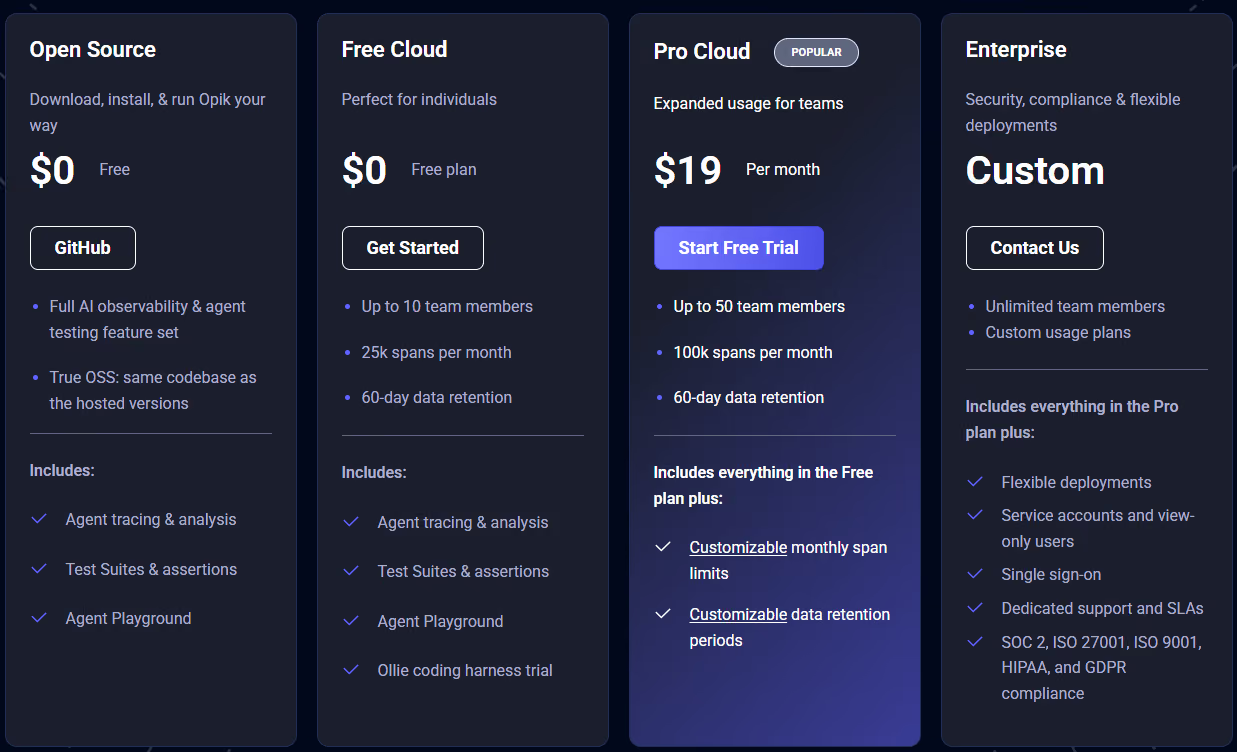
Opik is free to self-host. Free Cloud includes 25,000 spans per month and 60-day retention. Pro Cloud costs $19 per month with 100,000 spans and 60-day retention. Higher span limits and longer retention cost extra. Enterprise pricing is custom. Model-provider costs remain separate.
Pros and Cons
Opik combines tracing with behavioral assertions and quantitative evaluation, making it useful for growing a regression suite from real failures.
Validate LLM-judge decisions against human examples before making them release gates. Self-hosting leaves operations with your team. Compare spans generated by your instrumentation and your retention needs when estimating cloud cost.
The Best Langfuse Alternatives for LLM Observability
Each of these Langfuse alternatives offers a distinct path to tracing and improving your LLM-driven application. Consider your team’s priorities. Here are some alternatives we recommend:
- Kitaru: for replay-based regression tests using production sessions, alongside your live tracing platform.
- LangSmith: for teams combining agent tracing, evaluation, and deployment; assess its gateway beta separately.
- HoneyHive and Braintrust: for turning production traces into evaluation datasets and feedback workflows.
- Arize Phoenix: for deployment choice, tracing, experiments, and prompt iteration.
- Galileo: for evaluation and runtime policy requirements, subject to plan and deployment fit.
- PromptLayer: for prompt collaboration, visual workflows, and evaluation.
- Confident AI: for teams combining DeepEval tests with hosted tracing and review workflows.
📚 Relevant alternative articles to read:
Already collecting useful traces? Import Langfuse sessions into Kitaru, replay a proposed change against your agent code, and compare the results before it reaches users. Start with the Kitaru documentation.