
On this page
From 2005 to 2020, interactive web applications fueled a massive wave of B2B SaaS companies, creating over 100 unicorns and capturing nearly half of all venture funding. Today, we’re on the cusp of a similar shift driven by vertical AI agents.
A vertical AI agent is a specialized software built on top of LLMs, carefully tuned to automate real, high-value work. Unlike simple “ChatGPT wrappers,” these systems require deep domain expertise, real agentic architectures, and integration with legacy workflows to function in production.
A promising use case is financial report analysis, where a single LLM struggles to read long reports and extract key information. Multiple AI agents can be used to handle different tasks, improving the overall results.
In this blog, we’ll show you how to build a financial report analysis pipeline using ZenML, SmolAgents, and LangFuse. Managing AI agents can be tricky, so it’s important to have good visibility into how they work. Proper tracking allows us to spot any issues and understand how the agents are performing. Using reproducible pipelines also allows teams to keep track of their experiments, improve performance, and figure out what works best.
TL;DR
Financial document analysis is tedious. You’ve got hundreds of pages of dense filings, and somewhere in there are the insights that matter. We thought: what if AI could do the heavy lifting, but do it right?
What we built: A pipeline with 5 AI agents working together to analyze financial documents - like having a team of specialists (financial analyst, researcher, fact-checker, etc.) all working on the same report simultaneously.
What’s interesting: Instead of just summarizing documents, we combine real-time web research to create insights that go way beyond the original filing. Everything is reproducible and tracks how each conclusion was reached.
How ZenML helps: Handles the messy reality of AI workflows -tracks inputs, results, and keeps everything organized so you can reproduce any analysis months later.
What are AI Agents?
AI agents go beyond traditional LLMs by using tool calling, reasoning, and memory to complete complex tasks. Unlike standard chatbots that rely only on pre-trained data, AI agents can search the web, interact with APIs, and break problems into subtasks to improve accuracy.
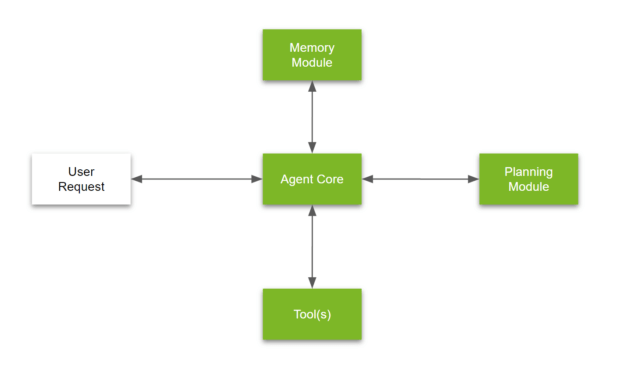
For basic agent-like behavior, like simple routing or sequential task execution, you’re better off writing the code yourself. This keeps things faster, more transparent, and easier to debug. But as soon as you introduce tool calling (where an LLM executes functions) or multi-step reasoning (where an LLM determines the next step based on prior actions), things get tricky.
This is where SmolAgents come in. They provide lightweight, composable building blocks for building agentic workflows without unnecessary overhead. Instead of using heavyweight agent frameworks, SmolAgents help structure key components like:
- A defined set of tools the agent can call
- A parser to extract tool calls from LLM output
- A structured system prompt that aligns with the parser
- Memory to track multi-step interactions
- Error handling & retries to manage LLM mistakes
However, for AI agents to be reliable, we need observability. This is the ability to monitor how AI agents make decisions. Tools like LangFuse provide real-time tracking, showing which tools an agent calls, what data it retrieves, and how decisions evolve. Without observability, debugging agent behavior becomes a nightmare.
Overview
Financial reports are long, dense, and packed with critical details; exactly the kind of content that financial analysts, investors, and regulators need to digest quickly. But manually summarizing thousands of reports? That’s slow, expensive, and prone to human error. Traditional automation struggles, too, since financial disclosures mix structured tables with unstructured narratives. Here’s an example of a bad report:
“The company reported revenue of $2.3B in Q4, up from previous periods. Management discussed various operational challenges and market conditions. Risk factors include regulatory changes and competitive pressures. The company plans to focus on growth initiatives and operational efficiency.”
The above is bad due to the following reasons:
- Lack of Specificity: Phrases like "up from previous periods" or "growth initiatives" are vague. Investors need numbers, not narratives.
- No Context: Without comparing performance to competitors, analyst expectations, or historical trends, the statement doesn’t help assess the company’s trajectory.
- No Judgment or Insight: The summary regurgitates management's talking points without challenging them. Which challenges are actually material? Are the growth plans feasible given debt levels, market conditions, or past execution?
- Fluff Over Substance: It sounds like a summary, but it's hollow. It leaves the reader with no actionable insight.
Solution
To tackle this, we’re building a financial report analysis pipeline using ZenML and SmolAgents. ZenML provides a structured way to manage our data pipelines, while SmolAgents offers lightweight, flexible AI agents that can process documents and extract key insights. Instead of running a single monolithic LLM call, we break the problem into chained steps: extracting, summarizing, and refining key insights across multiple stages.
Why Use Agents for This?
Traditional LLM workflows tend to be rigid; call the model, get a response, and move on. But, financial document analysis requires more nuanced decision-making. SmolAgents allows us to:
- Chain multiple steps together: First, an agent extracts relevant sections. Another agent summarizes those sections, and a final agent refines the output.
- Adapt dynamically: Instead of a one-size-fits-all model, we can swap tools, adjust prompts, and integrate different models as needed.
- Work with structured and unstructured data: Financial reports include balance sheets, text explanations, and regulatory filings. Agents let us process each differently.
Why ZenML + SmolAgents?
ZenML helps orchestrate the pipeline, ensuring smooth data flow and reproducibility. SmolAgents keeps the AI logic simple, modular, and extensible, allowing us to run agents efficiently in a few lines of code. This combination gives us the flexibility of LLMOps with the intelligence of AI agents.
from zenml import pipeline, step
from smolagents import CodeAgent, DuckDuckGoSearchTool, HfApiModel

@step
def agent_step(query: str) -> str:
    """ZenML step that uses a smolagent"""

    agent = CodeAgent(
        tools=[DuckDuckGoSearchTool()],
        model=HfApiModel()
    )

    result = agent.run(query)
    return result

@pipeline
def simple_agent_pipeline():
    """Pipeline with a single smolagent step"""

    result = agent_step(
        "How many seconds would it take for a leopard at full speed to run through Pont des Arts?"
    )

    return result

if __name__ == "__main__":
    pipeline_run = simple_agent_pipeline()
    result = pipeline_run.run()
    print(f"Agent result: {result}")
In the next sections, we’ll break down how this works in practice, from dataset handling to model execution.
Implementation
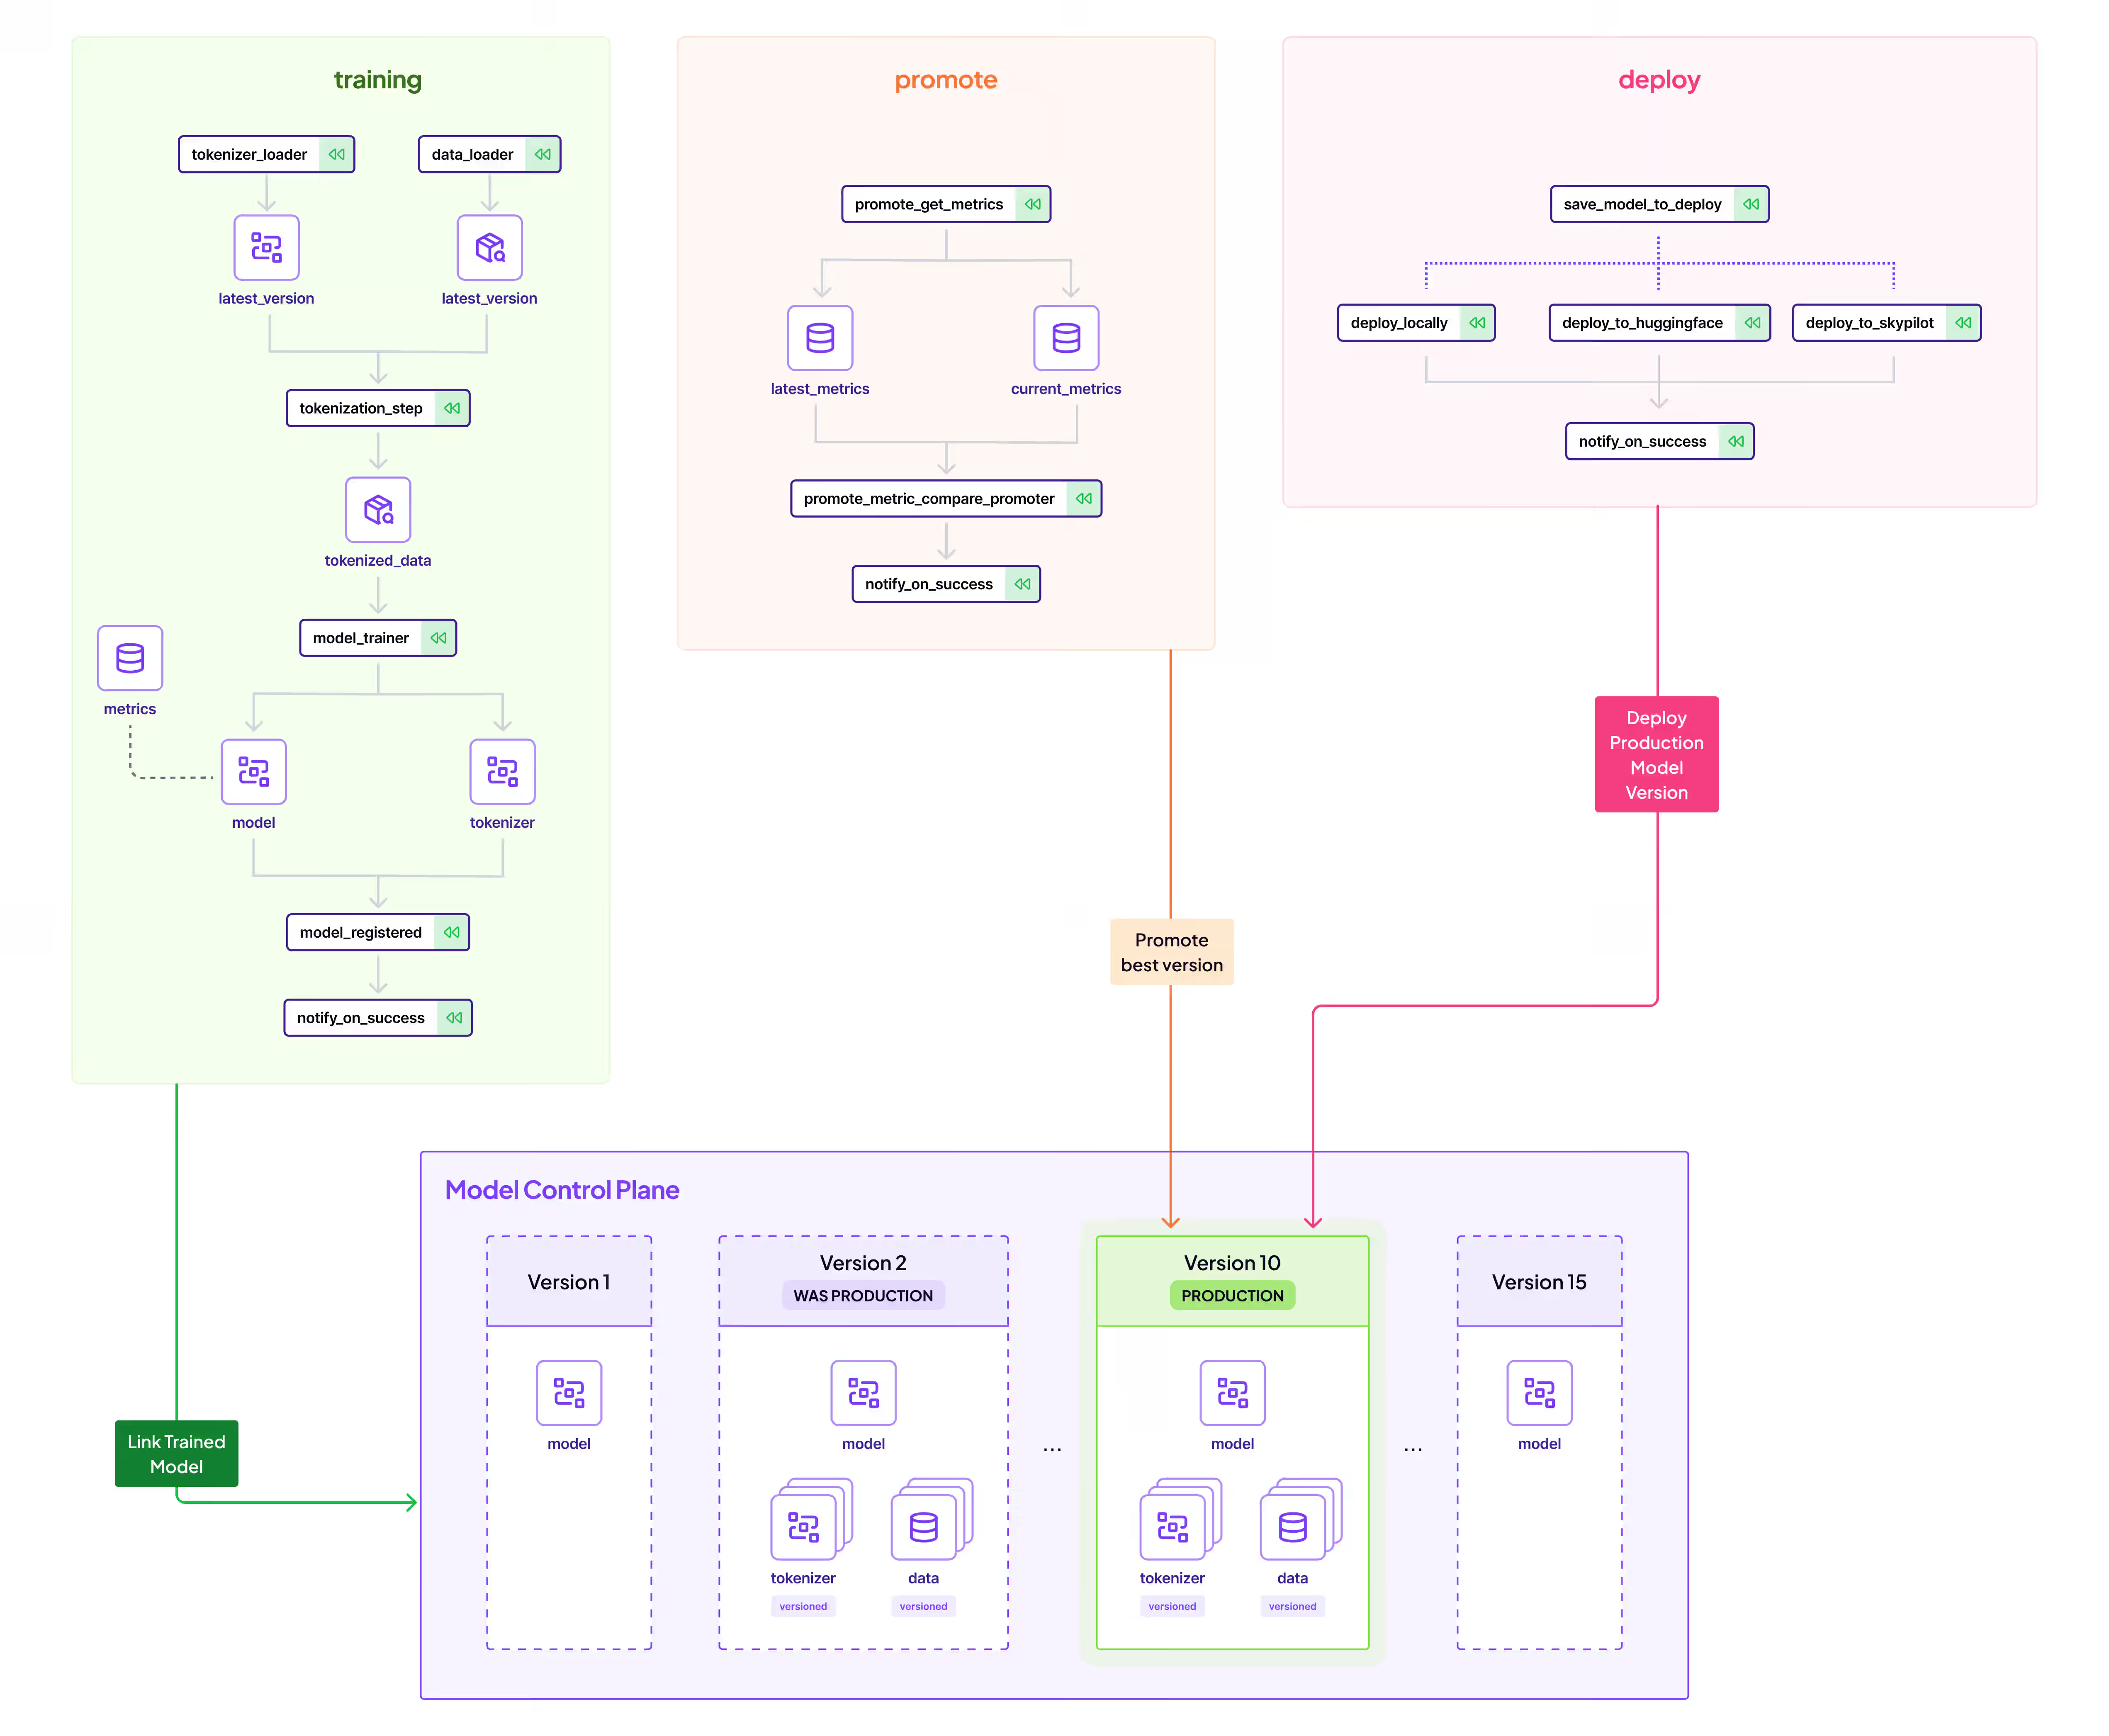
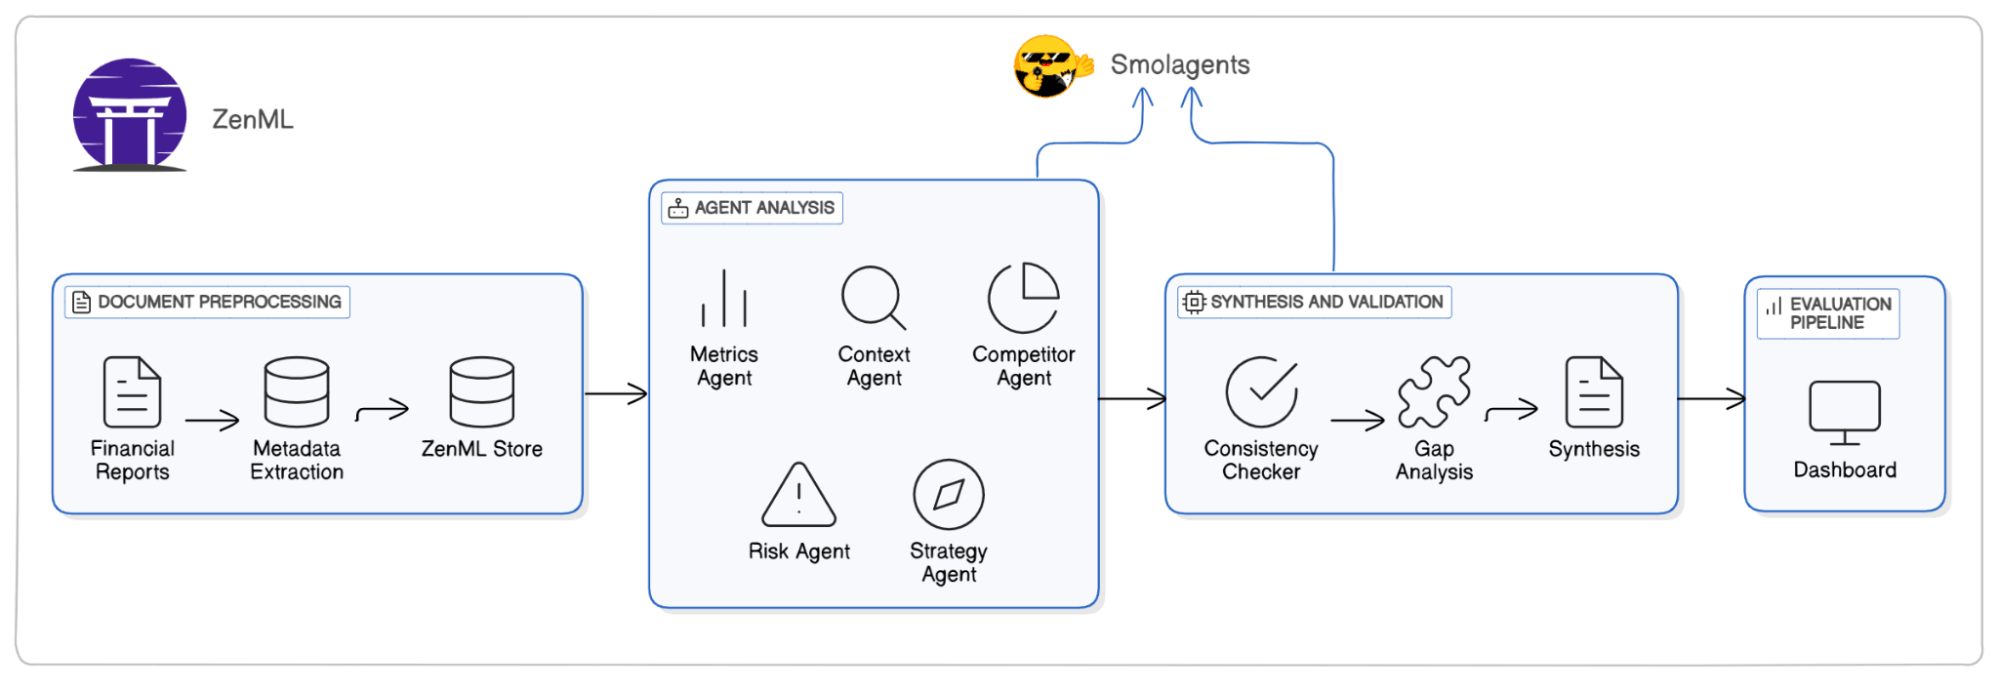
The diagram below represents a financial report analysis pipeline using ZenML and SmolAgents.
This system is designed to process financial reports, extract insights, and validate data using AI-powered agents. Here’s how it works:
1. Document Preprocessing
Financial reports are ingested, and metadata extraction is performed. Next, the extracted metadata is stored in the ZenML Store, ensuring structured data management.
2. Agent Analysis
A suite of AI agents processes the data to extract key insights:
- Metrics Agent: Identifies and extracts financial metrics.
- Context Agent: Understands the broader financial landscape.
- Competitor Agent: Conducts comparisons with competitor reports.
- Risk Agent: Assesses financial risks.
- Strategy Agent: Provides strategic recommendations.
3. Evaluation
The processed insights undergo evaluation by:
- Consistency Checker ensures data accuracy.
- Gap Analysis detects missing or conflicting information.
- Synthesis compiles the final structured financial insights.
4. Dashboard
The validated insights are displayed in a dashboard, providing a clear and actionable summary for decision-makers.
ZenML ensures the reproducibility of experiments, from data storage to visualization on the dashboard. For observability, all agents are tracked using LangFuse, enabling failure detection and LLM cost analysis. Let’s start with the setup.
Setup
Before building our financial report analysis pipeline, we need to set up the required tools and dependencies. This section walks through installing and configuring ZenML, Langfuse, and SmolAgents and setting up necessary API keys. Some agents require searching the web therefore, we have also required a SearchAPI API key.
Installing ZenML
ZenML is a powerful MLOps framework that simplifies the development and deployment of machine learning pipelines. To get started, first, create a virtual environment and install ZenML:
pip install zenmlZenML supports Python versions 3.9 through 3.12, so ensure you use a compatible version before proceeding.
Logging into ZenML Pro
ZenML offers a Pro version that enhances pipeline orchestration and monitoring. To log in:
- Go to ZenML Pro and sign in.
- Run the following command to authenticate:
zenml loginThis will open a login window. Once authenticated, you’ll be connected to ZenML.
Setting Up Langfuse
Langfuse is a robust observability platform for LLM applications. It allows tracking and debugging of model interactions. To get started:
- Sign up at Langfuse.
- Create an organization and invite team members (the free tier supports up to 2 users).
- Create a project and generate both a public and a secret key.
Langfuse’s free plan includes:
- Access to all platform features (with limits)
- 50,000 observations per month
- 30 days of data retention
- Community support via Discord and GitHub
Configuring API Keys
To enable the required integrations, set up API keys for:
- OpenAI: Obtain an API key from OpenAI
- SearchAPI: Sign up at SearchAPI to receive a free API key (100 free searches available)
Once you have your keys, create an .env file and populate it with the following:
OPENAI_API_KEY=your_openai_api_key
LANGFUSE_PUBLIC_KEY=your_langfuse_public_key
LANGFUSE_SECRET_KEY=your_langfuse_secret_key
HF_TOKEN=your_huggingface_token
SEARCHAPI_API_KEY=your_searchapi_key
Setting Up Your Environment with uv and virtualenv
To prepare your environment for building the financial report analysis pipeline using modern and performant tooling, follow these steps:
1. Create and Activate a Virtual Environment
First, create a new Python virtual environment and activate it:
python -m venv .venv
source .venv/bin/activate
2. Install uv
If you don’t already have uv installed, get it via pip:
pip install -U uv3. Define Your requirements.txt
Create a requirements.txt file with the following contents:
zenml
openai
pandas
smolagents[litellm]
smolagents[telemetry]
opentelemetry-sdk
opentelemetry-exporter-otlp
openinference-instrumentation-smolagents
langchain-core
Langchain-community
langfuse
pydantic
4. Install Packages Using uv
Now use uv to install all the dependencies efficiently:
uv pip install -r requirements.txtThis will ensure all packages are installed into your virtual environment.
Dataset
The FINDSum dataset is designed for financial document summarization. Unlike traditional datasets focusing only on text, FINDSum integrates numerical values from tables, improving summary informativeness.
It consists of 21,125 annual reports from 3,794 companies, divided into two subsets:
- FINDSum-ROO: Summarizes a company’s results of operations, comparing revenue and expenses over time.
- FINDSum-Liquidity: Focuses on liquidity and capital resources, assessing cash flow and financial stability.
Many critical financial figures appear exclusively in tables, making FINDSum a valuable resource for multi-modal document analysis. Combining structured and unstructured data enables more accurate financial summarization and evaluation.
How to Use the Dataset
The dataset is organized into text and table components. Text files contain segmented report texts, while table files hold numerical data. To use the dataset, load the text and table data, preprocess them, and apply summarization models. The data is present in Google Drive. Here’s the Github repository of the dataset.
How to Download the Dataset
The dataset is hosted on Google Drive and contains two main folders: text and table. To download these folders programmatically, we use the googledriver library, which simplifies downloading shared Google Drive files and folders. Use the following code to download the dataset:
from googledriver import download
URL = '...'

# Downloads the folder and saves its contents locally under the 'data/' directory
download(URL, output='data/')
This will create a data/ directory containing both text and table subfolders, each with their respective files. We have created a script to combine both tables and text data for accurate financial summarization and evaluation:
# Extract key metrics from financial tables
def extract_important_metrics(data):
    def safe_float(val):
        try: return float(val.replace(',', '').split('&')[-1])
        except: return None

    metrics = {}
    for section in ['mda_liquidity_tables', 'after_mda_tables']:
        if section in data[0]:
            for table in data[0][section]:
                for row in table:
                    label = row[0].lower()
                    if 'total assets' in label: metrics['total_assets'] = safe_float(row[2])
                    if 'sales' in label: metrics['sales'] = safe_float(row[2])
                    # Trimmed down the metrics, you can check out more on Github
    return metrics

# Merge and save
def save_metrics_to_csv(df, text_data, output_path):
    metrics = [extract_important_metrics([d]) for d in text_data]
    combined = pd.concat([df, pd.DataFrame(metrics)], axis=1)
    combined.to_csv(output_path, index=False)

# Real file paths for FINDSum-Liquidity dataset
csv_file_path = "text/FINDSum-Liquidity/liquidity_input_2000/train_liquidity_segment_2_input_2_1000.csv"
text_file_path = "table/FINDSum-Liquidity/train_liquidity_all_tuples_diff_sec.txt"
output_path = "output.csv"

df, text = load_findsum_data(csv_file_path, text_file_path)
save_metrics_to_csv(df, text, output_path)
The above script generates a CSV that consolidates all relevant structured and unstructured data, preparing it for the next stage in the pipeline: preprocessing.
Preprocessing
Before any meaningful analysis can take place, we need to preprocess the dataset by:
- Splitting them into logical sections (e.g., Management Discussion, Risk Factors, Financial Statements).
- Extracting key metadata such as company name, sector, fiscal year, and other metrics.
- Storing the structured document chunks in ZenML’s artifact store to track lineage and ensure reproducibility.
This section walks through the preprocessing pipeline, explaining how we extract and structure the data using ZenML and Smolagents.
Loading and Extracting Financial Data
We start by loading the raw financial reports. These reports come in two parts:
- A CSV file containing structured financial information.
- A JSON text file with additional financial tables and qualitative summaries.
The following function loads a subset of the dataset for initial processing:
import pandas as pd
import json

def load_findsum_data(csv_path, text_path, num_rows):
   # Load CSV file
   df = pd.read_csv(csv_path, sep=',', nrows=num_rows)

   # Load text file
   with open(text_path, 'r', encoding='utf-8') as f:
       text_data = [json.loads(line) for _, line in zip(range(num_rows), f)]

   return df, text_data
This function reads both the structured and unstructured data, returning them as a Pandas DataFrame and a list of JSON objects, respectively.
Extracting Key Financial Metrics
Once the data is loaded, we extract key financial figures such as total assets,liabilities, cash flow, and revenue. The extract_important_metrics functionscans the report’s structured financial tables and retrieves relevant figures:
def extract_important_metrics(data):
   metrics = {}

   def safe_float(value):
       """Safely converts a string value to a float, handling formatting issues."""
       try:
           if '&' in value:
               return float(value.split('&')[1].replace(',', ''))
           else:
               return float(value.replace(',', ''))
       except (ValueError, IndexError):
           return None

   # Extract liquidity-related metrics
   if 'mda_liquidity_tables' in data[0]:
       liquidity_data = data[0]['mda_liquidity_tables'][0]
       for item in liquidity_data:
           if 'total identifiable intangible assets' in item[0].lower():
               metrics['total_identifiable_intangible_assets'] = safe_float(item[2])
           elif 'trade names' in item[0].lower():
               metrics['trade_names'] = safe_float(item[2])

   # Extract balance sheet and income statement metrics
   if 'after_mda_tables' in data[0]:
       balance_sheet_data = data[0]['after_mda_tables'][0]
       for item in balance_sheet_data:
           if 'total assets' in item[0].lower():
               metrics['total_assets'] = safe_float(item[2])
           elif 'total liabilities' in item[0].lower():
               metrics['total_liabilities'] = safe_float(item[2])

   return metrics
Here, we:
- Define a helper function
safe_float()to clean and convert financial values. - Check different report sections and extract relevant financial metrics.
Saving Processed Data
Once extracted, the financial data is merged with the original dataset and savedas a CSV for downstream processing.
def save_metrics_to_csv(df, text_data, output_path):
   metrics_list = [extract_important_metrics([data]) for data in text_data]
   metrics_df = pd.DataFrame(metrics_list)
   combined_df = pd.concat([df, metrics_df], axis=1)
   combined_df.to_csv(output_path, index=False)
   print(f"Metrics and data saved to {output_path}")
We have a structured CSV file containing financial figures alongside the original text data at this stage.
Extracting Document Sections with an LLM
With the structured data saved, we now use a Large Language Model (LLM) to extract logical sections from the document text. ZenML provides a step-based workflow where each operation is defined as a step.
What Are ZenML Steps?
Steps in ZenML are Python functions annotated with the @step decorator. They encapsulate specific tasks, such as loading data or running an LLM-based extraction.
Example of a simple ZenML step:
from zenml import step

@step
def step_1() -> str:
   """Returns a string."""
   return "world"
Now, let’s define our preprocessing steps.
Step 1: Load Data
The first step reads the preprocessed CSV and loads it into a Pandas DataFrame.
#steps/data_processing.py

from zenml import step
import pandas as pd

@step
def load_data_step(file_path: str) -> pd.DataFrame:
   """
   Loads financial reports data from a local directory.
   """
   return pd.read_csv(file_path)
Step 2: Extract Document Sections with LLM
We use OpenAI’s GPT-4o model to break financial reports into sections like Management Discussion, Risk Factors, and Financial Statements.
#steps/data_preprocessing.py

from typing import Dict
from models.models import DocumentSections
from litellm import completion

@step
def llm_extract_sections_step(df: pd.DataFrame, model: str = gpt-4o) -> Dict[str, DocumentSections]:
    """
    Uses OpenAI structured parser to extract logical sections from the financial reports.
    """
    sections_data = {}

    for idx, row in df.iterrows():
        document_text = row['document']

        response = completion(
            model="gpt-4o",
            messages=[
                {"role": "system", "content": "Extract logical sections from financial reports."},
                {"role": "user", "content": document_text}
            ],
            response_format="json"
        )

        # Parse the JSON output into the pydantic schema
        parsed = DocumentSections.parse_obj(response["choices"][0]["message"]["content"])
        sections_data[str(idx)] = parsed
return sections_data
The DocumentSections is as follows:
from pydantic import BaseModel

class DocumentSections(BaseModel):
    management_discussion: str
    risk_factors: str
    financial_statements: str

class DocumentMetadata(BaseModel):
    company_name: str
    sector: str
    fiscal_year: str
Step 3: Extract Metadata
This step extracts structured metadata such as company name, fiscal year, and sector from the DataFrame.
#steps/data_processing.py

from typing import Dict, Any
from models.models import DocumentMetadata

@step
def llm_extract_metadata_step(df: pd.DataFrame) -> Dict[str, DocumentMetadata]:
   """
   Extracts financial metadata from the DataFrame.
   """
   extracted_metadata = {}

   for idx, row in df.iterrows():
       metrics = {
           "total_assets": row.get("total_assets", None),
           "total_liabilities": row.get("total_liabilities", None),
           "net_earnings": row.get("net_earnings", None),
           …
       }

       extracted_metadata[idx] = DocumentMetadata(**metrics)

   return extracted_metadata
Step 4: Store Structured Data in ZenML
Finally, we store the extracted sections and metadata in ZenML’s artifact store.
#steps/data_processing.py

from zenml import step, ArtifactConfig
from typing import Dict, Any

@step
def store_structured_data_step(sections_data: Dict[str, DocumentSections], metadata_data: Dict[Any, Any]) -> Dict[str, Any]:
   """
   Stores structured document chunks in a ZenML artifact store.
   """
   structured_data = {
       idx: {
           "sections": sections_data[idx],
           "metadata": vars(metadata_data[int(idx)])
       }
       for idx in sections_data
   }
   return structured_data
Orchestrating the Steps with a ZenML Pipeline
In ZenML, a pipeline defines the execution order of steps. The following pipeline loads the dataset, extracts sections and metadata, and stores the results.
#pipelines/data_processing.py
from zenml import pipeline
from steps.data_processing import load_data_step, store_structured_data_step, llm_extract_metadata_step, llm_extract_sections_step
@pipeline
def document_processing_pipeline(file_path: str):
"""ZenML pipeline that orchestrates document loading, processing, and storing."""
df = load_data_step(file_path)
section_data, metadata_data = llm_extract_sections_step(df), llm_extract_metadata_step(df)
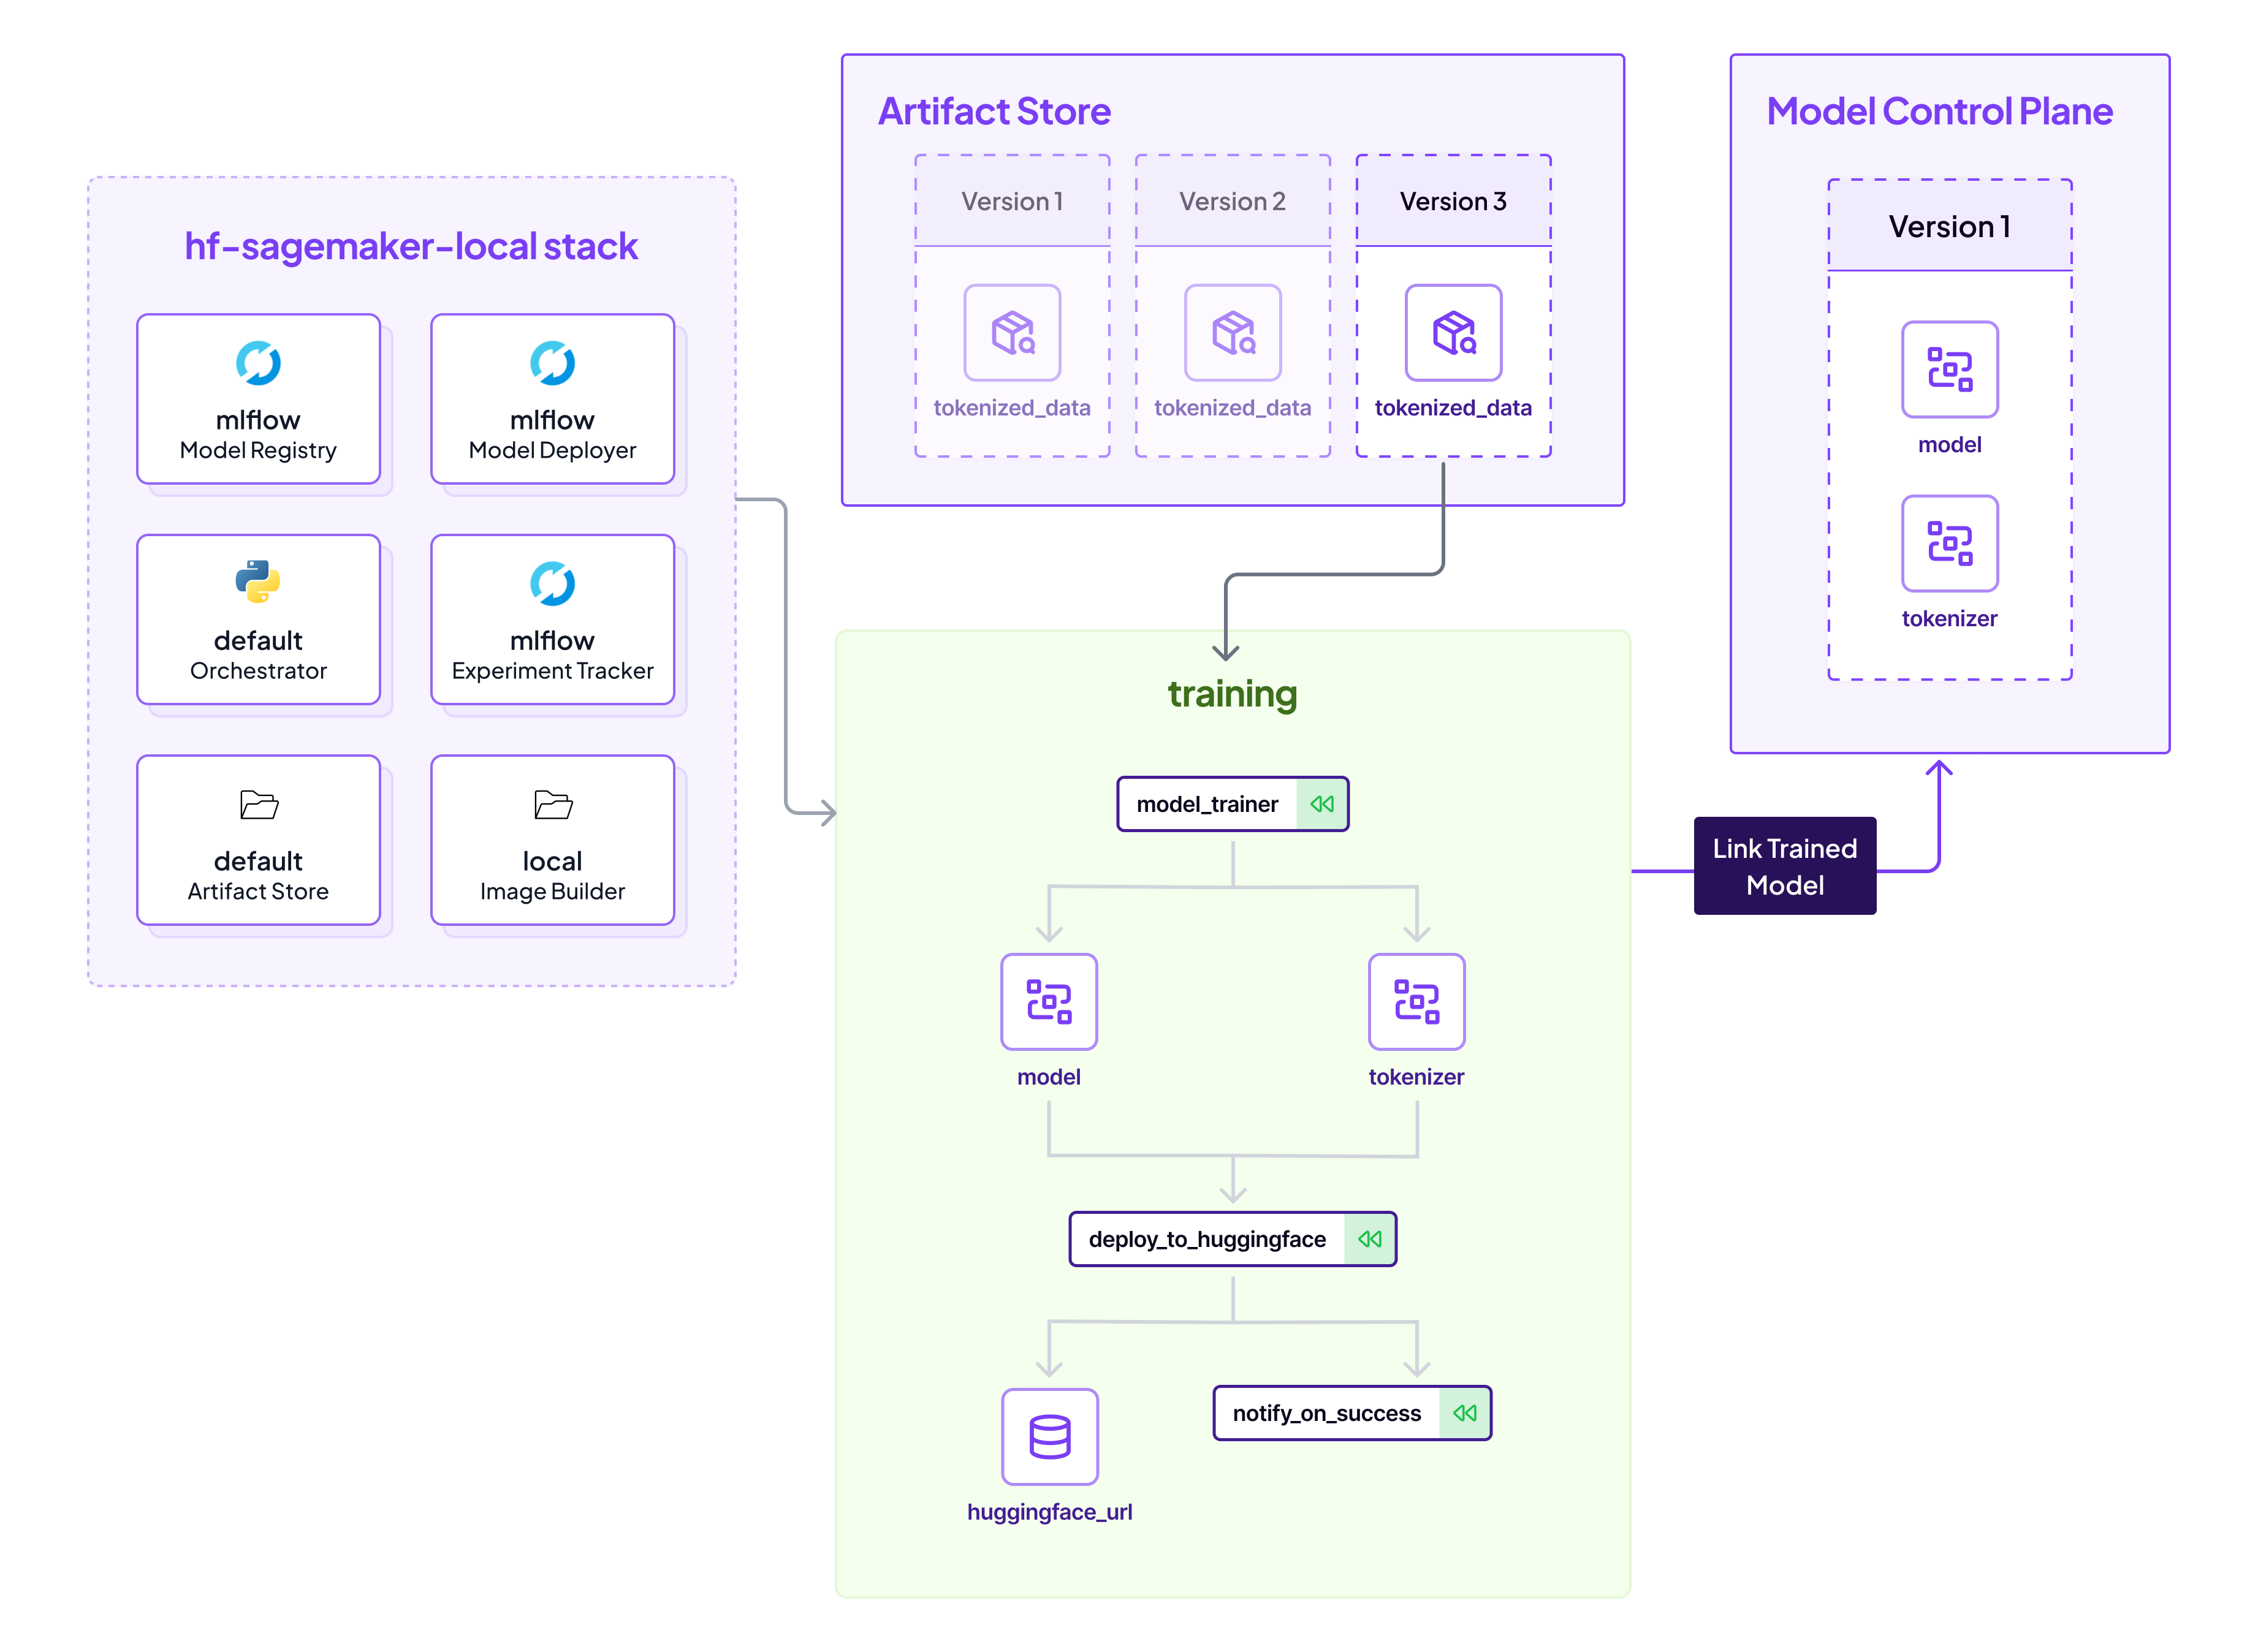
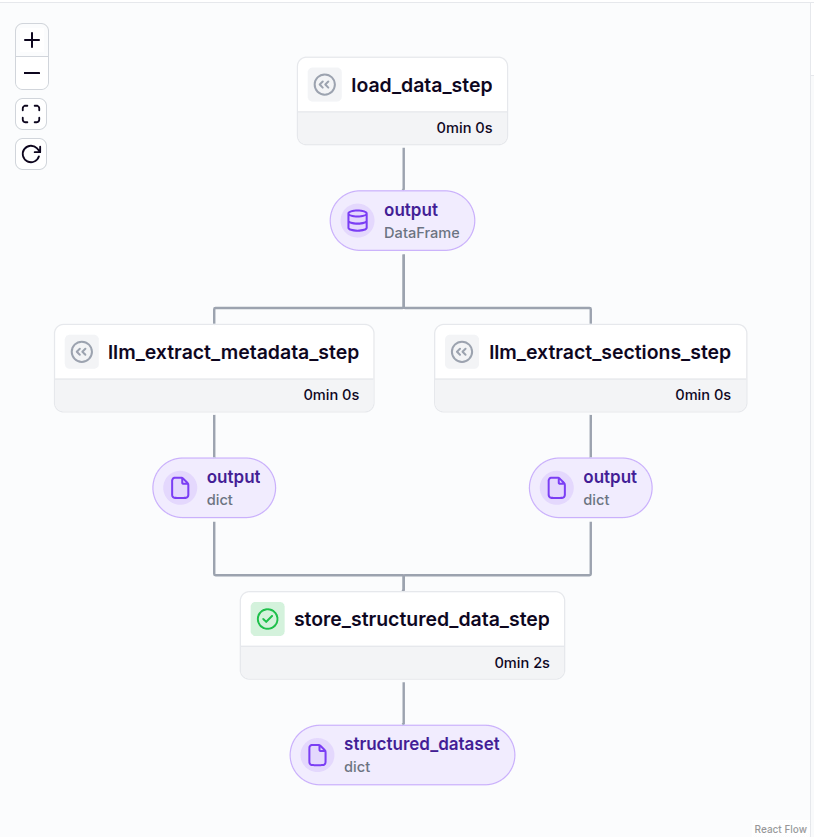
store_structured_data_step(section_data, metadata_data)This pipeline ensures each step runs sequentially and tracks outputs for lineage and reproducibility. Here is the DAG (direct acyclic graph) for the pipeline:
Agent Analysis
In this section, we break down the role of each agent in the Financial Report Analysis Pipeline, using ZenML and Smolagents to extract, analyze, and contextualize financial data. Each agent operates as an independent ZenML step, focusing on specific analytical tasks. Let’s explore how they function and interact.
What is a Code Agent in SmolAgent?
In a multi-step agent system, an LLM (Large Language Model) writes an action at each step (typically as JSON instructions) containing tool names and arguments. For example:
{ "tool": "web_search", "input": "greenland denmark" }However, research suggests that expressing these actions in executable code leads to more effective tool execution.
This approach aligns with how programming languages are optimized for defining computational tasks, making them superior to JSON-based action calls. For example:
requests_to_search = ["gulf of mexico america", "greenland denmark", "tariffs"]
for request in requests_to_search:
    print(f"Here are the search results for {request}:", web_search(request))
HuggingFace SmolAgents has addressed this by introducing CodeAgent. CodeAgent has several benefits over JSON format:
- Fewer Steps: CodeAgents use 30% fewer steps to complete tasks compared to the traditional ReAct-style agents, which reduces the number of LLM calls and speeds up workflows.
- Higher Accuracy: Especially on complex, multi-step tasks, CodeAgents outperform traditional agents by chaining logic better through code.
- More Natural for Programmers: If you're already working in Python, CodeAgents just feel more intuitive.
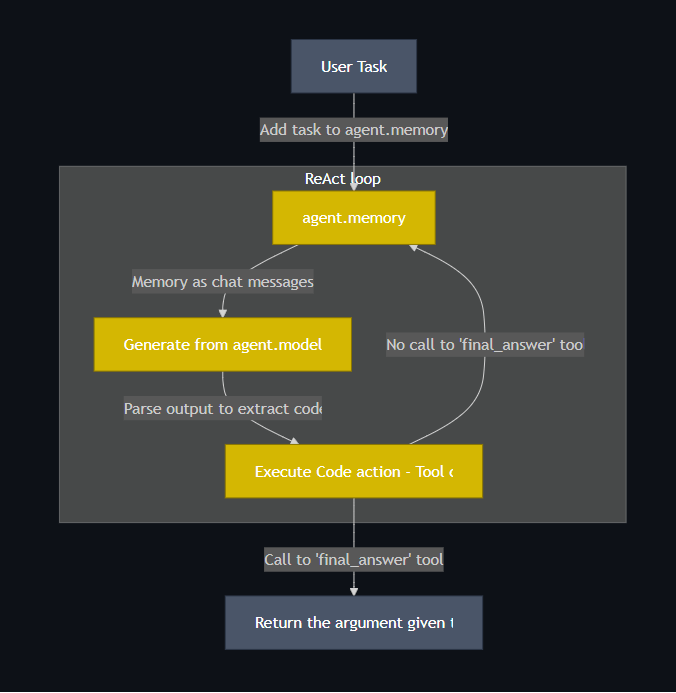
This approach is inspired by ReAct (Reasoning + Acting) agents, a framework where the agent reasons out loud and performs actions to solve tasks. CodeAgents are like ReAct—but with Python code as the “act” part.
Now, let’s take a closer look at the different agents and the tools they use.
1. Financial Metrics Agent
The Financial Metrics Agent focuses on extracting and normalizing key financial indicators such as revenue, profit margins, and debt ratios. It uses a set of tools, each responsible for a different aspect of financial metric extraction.
Extracting Revenue Metrics
The extract_revenue_metrics function retrieves and normalizes revenue-related figures, calculating growth rates where applicable:
#tools/financial_metric_tool.py

from typing import Dict, Any
from smolagents import tool

@tool
def extract_revenue_metrics(financial_statements: Dict[str, Any]) -> Dict[str, float]:
   """ Extracts revenue metrics from financial statements. """
   revenue_data = financial_statements.get("income_statement", {}).get("revenue", {})
   current_revenue = revenue_data.get("current", 0)
   previous_revenue = revenue_data.get("previous", 0)
   growth_rate = ((current_revenue - previous_revenue) / previous_revenue) * 100 if previous_revenue > 0 else 0

   return {
       "current_revenue": current_revenue,
       "previous_revenue": previous_revenue,
       "revenue_growth_rate": growth_rate,
       "revenue_cagr_3yr": revenue_data.get("cagr_3yr", 0)
   }
This function ensures a structured extraction of revenue data, including growth rates and three-year CAGR, for deeper trend analysis.
Analyzing Profit Margins
Similarly, analyze_profit_margins calculates various profit-related metrics:
#tools/financial_metric_tool.py

@tool
def analyze_profit_margins(financial_statements: Dict[str, Any]) -> Dict[str, float]:
   """ Calculates profit margin metrics from financial statements. """
   income_statement = financial_statements.get("income_statement", {})
   revenue = income_statement.get("revenue", {}).get("current", 0)
   gross_profit = income_statement.get("gross_profit", 0)
   operating_income = income_statement.get("operating_income", 0)
   net_income = income_statement.get("net_income", 0)

   gross_margin = (gross_profit / revenue) * 100 if revenue > 0 else 0
   operating_margin = (operating_income / revenue) * 100 if revenue > 0 else 0
   net_margin = (net_income / revenue) * 100 if revenue > 0 else 0

   return {
       "gross_margin": gross_margin,
       "operating_margin": operating_margin,
       "net_margin": net_margin,
       "industry_avg_net_margin": income_statement.get("industry_avg_net_margin", 0)
   }
This function ensures we capture critical profitability indicators for financial health assessment.
Calculating Debt Ratios
Debt analysis is crucial in financial reporting. The calculate_debt_ratios function provides various leverage and liquidity ratios:
#tools/financial_metric_tool.py

@tool
def calculate_debt_ratios(balance_sheet: Dict[str, Any]) -> Dict[str, float]:
   """ Calculates debt-related ratios from balance sheet data. """
   total_assets = balance_sheet.get("total_assets", 0)
   total_debt = balance_sheet.get("total_debt", 0)
   total_equity = balance_sheet.get("total_equity", 0)
   current_assets = balance_sheet.get("current_assets", 0)
   current_liabilities = balance_sheet.get("current_liabilities", 1)

   debt_to_equity = total_debt / total_equity if total_equity > 0 else 0
   debt_to_assets = total_debt / total_assets if total_assets > 0 else 0
   current_ratio = current_assets / current_liabilities

   return {
       "debt_to_equity": debt_to_equity,
       "debt_to_assets": debt_to_assets,
       "current_ratio": current_ratio,
       "industry_avg_debt_to_equity": balance_sheet.get("industry_avg_debt_to_equity", 0)
   }
This tool ensures a structured breakdown of financial leverage using industry-standard debt metrics.
The best part about agents is that when the agent calls these functions, it extracts the arguments from the unstructured data and then calls them.
2. Market Context Agent
The Market Context Agent uses external data sources to gather news, market trends, and analyst opinions on a company. It relies on search_recent_news, search_market_trends, and search_analyst_opinions.
#tools/market_context_tool.py

from langchain_community.utilities import SearchApiAPIWrapper
search = SearchApiAPIWrapper(searchapi_api_key='API_Key')

@tool
def search_recent_news(company_name: str) -> Dict[str, Any]:
   """Searches for recent news about a given company."""
   search_query = f"{company_name} latest news"
   search_results = search.run(search_query)
   return { "company": company_name, "recent_news": search_results }
This tool retrieves the latest market news, helping analysts understand external influences on financial performance. Similarly, here are the other two tools:
#tools/market_context_tool.py

@tool
def search_market_trends(company_name: str) -> Dict[str, Any]:
   """
   Searches for current market trends related to a given company.

   Args:
       company_name: The name of the company to search for.

   Returns:
       Dictionary containing market trends.
   """
   search_query = f"{company_name} market trends"
   search_results = search.run(search_query)

   return {
       "company": company_name,
       "market_trends": search_results
   }

@tool
def search_analyst_opinions(company_name: str) -> Dict[str, Any]:
   """
   Searches for analyst opinions and insights on a given company.

   Args:
       company_name: The name of the company to search for.

   Returns:
       Dictionary containing analyst opinions and insights.
   """
   search_query = f"{company_name} analyst opinions"
   search_results = search.run(search_query)

   return {
       "company": company_name,
       "analyst_opinions": search_results
   }
Here’s how we combine them in a ZenML step:
#steps/agent_analysis.py

from zenml import step
from smolagents import LiteLLMModel, CodeAgent

@step
def financial_metric_agent(query: str) -> str:
   tools = [extract_revenue_metrics, analyze_profit_margins, calculate_debt_ratios]
   model = LiteLLMModel(model_id="gpt-4o")
   agent = CodeAgent(tools=tools, model=model)
   return agent(query)

@step
def market_context_agent(query: str)  -> Annotated[str,"context_result"]:

   tools=[search_analyst_opinions, search_recent_news, search_market_trends]
   financial_model = LiteLLMModel(model_id=GENERATION_MODEL)
   market_context_agent = CodeAgent(
       tools=tools,
       model=financial_model
   )
   result = market_context_agent(query)

   return result
This structured approach ensures that financial insights are extracted, contextualized, and analyzed efficiently. Three more agents, Competitor Analysis, Risk Assessment, and Strategic Direction Agents, enrich the financial analysis pipeline. More details can be found in the Github repository.
Pipeline Integration
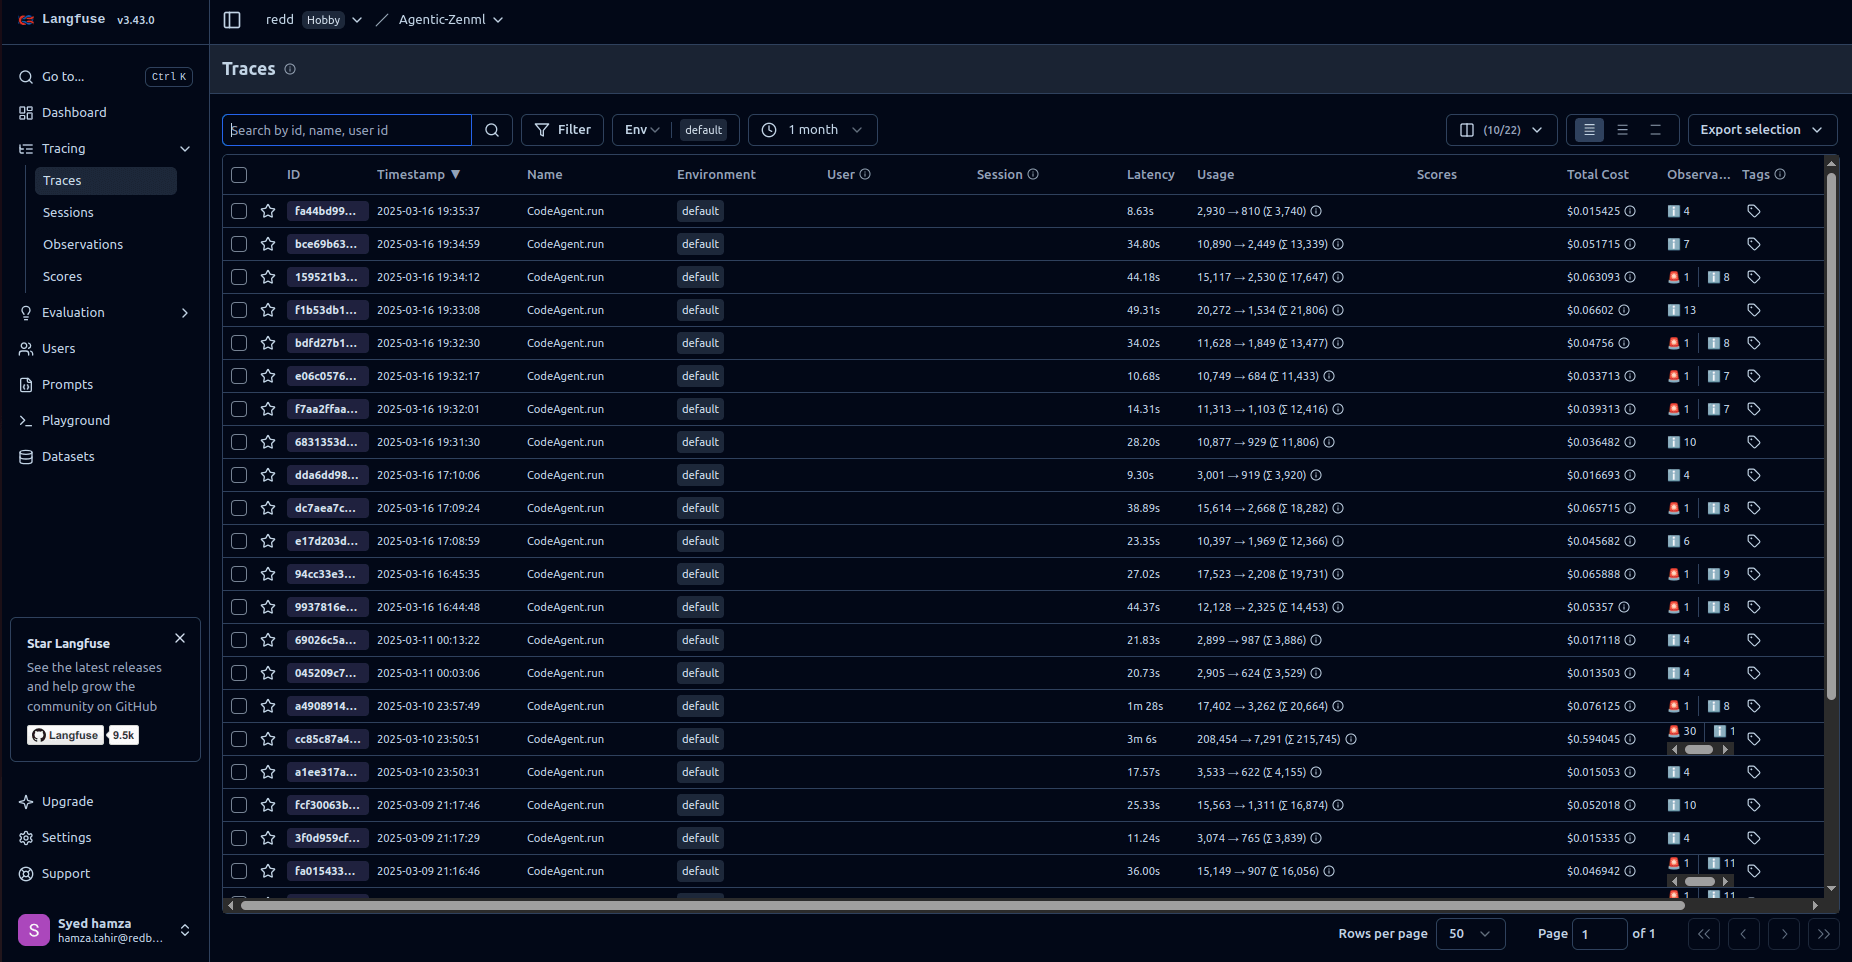
Here’s how to orchestrate the steps using the ZenML pipeline. It’s integrated with observability via OpenTelemetry (OTel) and Langfuse for tracing and monitoring. Multiple AI-powered agents perform financial and strategic assessments based on provided data.
# pipelines/agent_analysis_pipeline.py
load_dotenv()
LANGFUSE_PUBLIC_KEY = os.getenv("LANGFUSE_PUBLIC_KEY")
LANGFUSE_SECRET_KEY= os.getenv("LANGFUSE_SECRET_KEY")
LANGFUSE_AUTH=base64.b64encode(f"{LANGFUSE_PUBLIC_KEY}:{LANGFUSE_SECRET_KEY}".encode()).decode()
os.environ["OTEL_EXPORTER_OTLP_ENDPOINT"] = "https://cloud.langfuse.com/api/public/otel"
os.environ["OTEL_EXPORTER_OTLP_HEADERS"] = f"Authorization=Basic {LANGFUSE_AUTH}"
os.environ["HF_TOKEN"] = os.getenv("HF_TOKEN")
langfuse = Langfuse(
secret_key=LANGFUSE_SECRET_KEY,
public_key=LANGFUSE_SECRET_KEY,
host="https://cloud.langfuse.com"
)
@pipeline()
def agent_analysis_pipeline(data: Dict):
"""
ZenML pipeline that orchestrates document loading, processing, and storing.
"""
trace_provider = TracerProvider()
trace_provider.add_span_processor(SimpleSpanProcessor(OTLPSpanExporter()))
SmolagentsInstrumentor().instrument(tracer_provider=trace_provider)
metric_query = MARKET_CONTEXT_PROMPT.format(data = data)
context_query = FINANCIAL_METRICS_PROMPT.format(data = data)
competitor_query = COMPETITOR_ANALYSIS_PROMPT.format(data = data)
risk_query = RISK_PROMPT.format(data = data)
strategy_query = STRATEGY_PROMPT.format(data = data)
metric_result = financial_metric_agent(metric_query)
context_result = market_context_agent(context_query)
competitor_result = competitor_analysis_agent(competitor_query)
risk_result = risk_assesment_agent(risk_query)
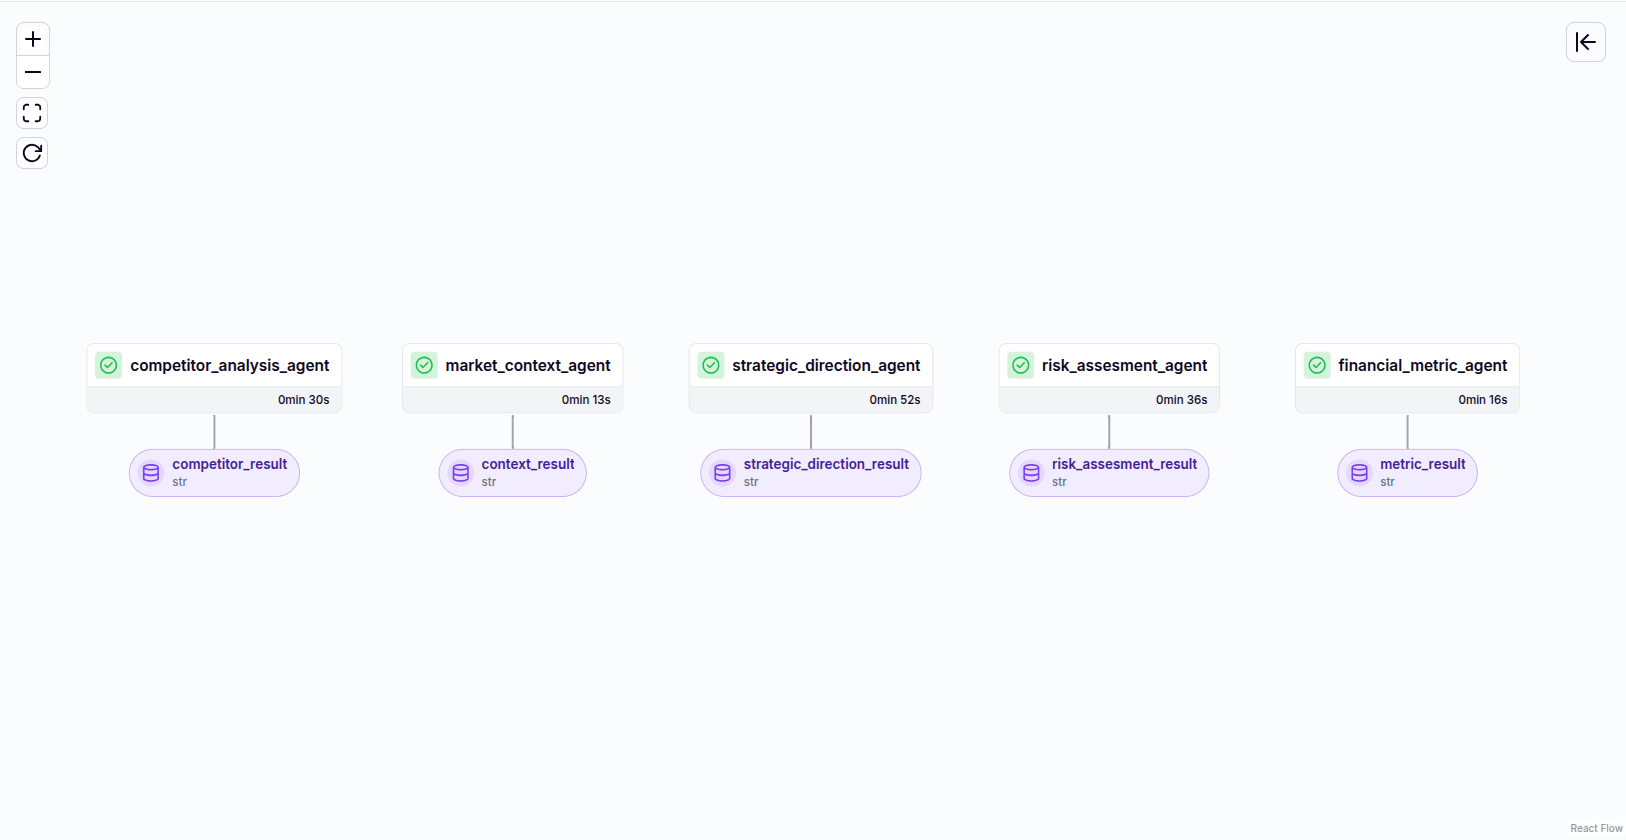
strategy_result = strategic_direction_agent(strategy_query)Here’s what the DAG looks like:
Here we will take a moment to discuss on Langfuse capabilities and value. It provides comprehensive trace data that is invaluable for both debugging and cost analysis. Understanding how to interpret these traces can significantly enhance the efficiency and cost-effectiveness of your LLM applications.
Debugging with Langfuse
Each trace in Langfuse captures the flow of a request through various components, such as retrievers and LLMs. By examining these traces, developers can:
- Identify Errors: Pinpoint the exact stage where an error occurred, facilitating quicker resolution.
- Analyze Latency: Determine which components contribute most to processing time, aiding in performance optimization.
- Monitor Token Usage: Track input and output tokens to understand and optimize token consumption.
For instance, if a particular component consistently shows high latency or token usage, it may be a candidate for optimization or replacement.
Cost Analysis with Langfuse
Langfuse allows for detailed cost tracking by associating costs with traces. This is particularly useful when dealing with multiple LLM providers or custom models. By analyzing trace metadata, developers can:
- Estimate Costs: Calculate costs based on token usage and predefined rates.
- Identify Cost Drivers: Determine which components or queries are the most expensive.
- Optimize Resource Allocation: Make informed decisions about where to allocate resources for maximum efficiency.
By regularly reviewing these metrics, developers can maintain optimal performance and cost-efficiency in their LLM applications.
After the pipeline run is completed, a trace of the run, including all the agents, will be produced. Here’s what it will look like:
To maintain separation of concerns, all prompts have been organized within the config folder. Below are the prompts used by each of the agents:
RISK_ASSESSMENT_SYSTEM_PROMPT = """You are a Risk Assessment AI tasked with analyzing company risk disclosures.
Your job is to examine the provided risk statements and cross-reference them with external risk factors such as market volatility, regulatory changes, and industry-specific challenges.
Generate a comprehensive analysis that highlights both internal vulnerabilities and external risks.
"""

RISK_ASSESSMENT_USER_PROMPT = """
Review the following company's financial disclosures and risk statements.

**Company Data:**
{company_data}

Provide a detailed risk assessment report that identifies potential risk exposures and evaluates the impact of external factors.
"""

STRATEGIC_DIRECTION_SYSTEM_PROMPT = """You are a Strategic Direction AI that evaluates a company's stated strategy in the context of its market position and execution history.
Your task is to analyze the provided strategic disclosures, compare them with industry trends and past performance, and assess the viability and coherence of the company's strategy.
"""

STRATEGIC_DIRECTION_USER_PROMPT = """
Examine the following company's financial disclosures and strategic statements.

**Company Data:**
{company_data}

Evaluate the alignment of the company's strategy with its market position and historical execution.
Provide a detailed report on the strategic strengths, potential gaps, and recommendations for improvement.
"""

CONSISTENCY_SYSTEM_PROMPT = """You are a Consistency Checker AI that validates information across multiple sources.
Your job is to check for contradictions between agent responses and company-provided data.
If discrepancies exist, highlight them clearly.
"""
CONSISTENCY_USER_PROMPT = """
Cross-validate the information from different agents for contradictions.

**Metric Result:**
{metric_result}

**Context Result:**
{context_result}

**Company Data:**
{company_data}

Identify any inconsistencies and provide a detailed report.
"""

GAP_SYSTEM_PROMPT = "You are a financial analysis assistant that identifies missing data and suggests further research."
GAP_USER_PROMPT = """
Identify any missing critical information that could affect financial analysis.
If necessary, suggest additional research topics.
Metric Result:
{metric_result}

**Context Result:**
{context_result}

**Competitor Result:**
{competitor_result}

**Company Data:**
{company_data}
"""
SYNTHESIS_SYSTEM_PROMPT = "You are a financial synthesis assistant that creates structured financial reports with attributed sources."

SYNTHESIS_USER_PROMPT = """
Combine the findings into a structured financial analysis report, ensuring clarity and proper source attribution.

**Metric Result:**
{metric_result}

**Context Result:**
{context_result}

**Competitor Result:**
{competitor_result}

**Contradictory Result:**
{contradictory_result}

**Gap Analysis Result:**
{gap_analysis_result}
"""

FINANCIAL_METRICS_PROMPT = "For the following data:\n {data} \n. These are the tasks needs to be performed: \n" \
"- Extracts revenue metrics from financial statements. " \
"- Calculates profit margin metrics from financial statements. " \
"- Calculates debt-related ratios from balance sheet data."

COMPETITOR_ANALYSIS_PROMPT = "For the following data:\n {data} \n. These are the tasks needs to be performed: \n" \
"- Identifies main competitors for a given company by searching online. " \
"- Retrieves the three most important financial metrics for a given competitor." \

MARKET_CONTEXT_PROMPT = "For the following data:\n {data} \n. These are the tasks needs to be performed: \n" \
" - Searches for recent news about a given company. " \
" - Searches for current market trends related to a given company." \
" - Searches for analyst opinions and insights on a given company."

RISK_PROMPT = (
"For the following data:\n {data} \nThese are the tasks that need to be performed:\n"
" - Analyze the company's risk disclosures for potential vulnerabilities.\n"
" - Identify external risk factors such as regulatory changes, market shifts, and industry disruptions.\n"
" - Compare company-stated risks with external conditions to highlight missing or underestimated threats.\n"
" - Provide a comprehensive risk assessment report with actionable insights."
)

STRATEGY_PROMPT = (
"For the following data:\n {data} \nThese are the tasks that need to be performed:\n"
" - Review the company's stated strategic objectives and growth plans.\n"
" - Compare the strategy against the company's market position, financial health, and competitive landscape.\n"
" - Evaluate historical execution trends to assess the feasibility of the current strategy.\n"
" - Identify potential misalignments, strengths, and areas for improvement in the strategic direction.\n"
" - Provide a detailed strategy evaluation report with recommendations."
)

EXTRACTION_SYSTEM_PROMPT = """
You are a financial analyst expert at extracting structured information from business analysis reports.

Your task is to extract financial metrics, competitor information, contradictions, and context from the provided business analysis text.

Guidelines:

- Extract financial metrics with proper formatting (include units like million, %, etc.)
- Identify competitor companies and competitive landscape insights
- Note any contradictions, validation needs, or analytical gaps mentioned
- Preserve important contextual information about the company
- If a metric is not found, leave it as null
- Be precise and only extract information that is explicitly stated
"""

EXTRACTION_USER_PROMPT = ("""
Please extract structured information from this business analysis:

{input_text}

Extract the financial metrics, competitor analysis, contradictions/validation needs, and key context according to the specified structure.
""")
Synthesis & Validation
As many agents work together, it’s important to check data consistency and completeness by providing a source of truth. To ensure high-quality financial analysis, we use a multi-agent system that verifies, enhances, and synthesizes financial reports. This approach involves three AI-driven agents:
- Consistency Checker: Cross-validates financial metrics, market context, and competitor data for contradictions.
- Gap Analysis Agent: Identifies missing critical information and suggests areas requiring further research.
- Synthesis Agent: Compiles all findings into a cohesive report with properly attributed sources.
Each agent plays a vital role in ensuring data accuracy and completeness. Here’s how:
Consistency Checker
The Consistency Checker detects contradictions in financial data by cross-referencing information from various sources, such as financial metrics, market trends, and company-reported data.
@tool
def consistency_checker(metric_result: Dict[str, Any], context_result: Dict[str, Any], company_data: Dict[str, Any]) -> str:
    """
    Cross-validates financial metrics, market trends, and competitor analysis against
    company-reported data to detect inconsistencies.
    """
    completion = client.chat.completions.create(
        model="gpt-4o",
        messages=[
            {"role": "system", "content": CONSISTENCY_SYSTEM_PROMPT},
            {"role": "user", "content": CONSISTENCY_USER_PROMPT.format(
                metric_result=metric_result,
                context_result=context_result,
                company_data=company_data
            )}
        ]
    )
    return completion.choices[0].message
Using OpenAI’s GPT-4o, the agent ensures that financial insights are free from contradictions before being used in decision-making.
Gap Analysis Agent
The Gap Analysis Agent identifies missing data points and suggests areas for further investigation. This ensures that all critical information is included before synthesis.
@tool
def gap_analysis(metric_result: Dict[str, Any], context_result: Dict[str, Any], competitor_result: Dict[str, Any], company_data: Dict[str, Any]) -> str:
    """
    Identifies missing critical information in the provided financial analysis.
    """
    completion = client.chat.completions.create(
        model="gpt-4o",
        messages=[
            {"role": "system", "content": GAP_SYSTEM_PROMPT},
            {"role": "user", "content": GAP_USER_PROMPT.format(
                metric_result=metric_result,
                context_result=context_result,
                competitor_result=competitor_result,
                company_data=company_data
            )}
        ]
    )
    return completion.choices[0].message
By addressing data gaps early, this agent enhances the reliability of financial reports.
Synthesis Agent
The Synthesis Agent consolidates all findings into a well-structured financial report. It integrates data from the Consistency Checker and Gap Analysis Agent, ensuring clarity and proper attribution.
@tool
def synthesis(metric_result: Dict[str, Any], context_result: Dict[str, Any], competitor_result: Dict[str, Any], contradictory_result: Dict[str, Any], gap_analysis_result: Dict[str, Any]) -> str:
    """
    Synthesizes financial analysis into a cohesive report with properly attributed sources.
    """
    completion = client.chat.completions.create(
        model="gpt-4o",
        messages=[
            {"role": "system", "content": SYNTHESIS_SYSTEM_PROMPT},
            {"role": "user", "content": SYNTHESIS_USER_PROMPT.format(
                metric_result=metric_result,
                context_result=context_result,
                competitor_result=competitor_result,
                contradictory_result=contradictory_result,
                gap_analysis_result=gap_analysis_result
            )}
        ]
    )
    return {"synthesis_report": completion.choices[0].message.content.strip()}
This step ensures the final report is comprehensive and well-structured.
Agent Validation Steps
We use the tools outlined above and the CodeAgent from SmolAgents to process the query. The query is formatted to invoke the appropriate functions and deliver the responses.
@step
def consistency_agent(query: str) -> Annotated[str, "consistency_result"]:
    tools = [consistency_checker]
    financial_model = LiteLLMModel(model_id=GENERATION_MODEL)
    consistency_agent = CodeAgent(tools=tools, model=financial_model)
    return consistency_agent(query)

@step
def gap_agent(query: str) -> Annotated[str, "gap_result"]:
    tools = [gap_analysis]
    financial_model = LiteLLMModel(model_id=GENERATION_MODEL)
    gap_agent = CodeAgent(tools=tools, model=financial_model)
    return gap_agent(query)

@step
def synthesis_agent(query: str) -> Annotated[str, "synthesis_result"]:
    tools = [synthesis]
    financial_model = LiteLLMModel(model_id=GENERATION_MODEL)
    synthesis_agent = CodeAgent(tools=tools, model=financial_model)
    return synthesis_agent(query)
Each step ensures that data flows through a structured validation process.
Final Pipeline Execution
The pipeline integrates ZenML, Langfuse, and OpenTelemetry for end-to-end validation, observability, and tracking.
@pipeline()
def agent_validation_pipeline(agent_responses: Dict, data: Dict) -> Annotated[Dict[str, Any], "validated_report"]:
"""ZenML pipeline that orchestrates validation and synthesis of financial analysis."""
trace_provider = TracerProvider()
trace_provider.add_span_processor(SimpleSpanProcessor(OTLPSpanExporter()))
SmolagentsInstrumentor().instrument(tracer_provider=trace_provider)
consistency_query = f"""Validate the consistency of the following:
Metric Results: {agent_responses['metric_result']}
Context Result: {agent_responses['context_result']}
Competitor Result: {agent_responses['competitor_result']}
Company Data: {data}
"""
gap_query = f"""Identify gaps in the following information:
Metric Results: {agent_responses['metric_result']}
Context Result: {agent_responses['context_result']}
Competitor Result: {agent_responses['competitor_result']}
Company Data: {data}
"""
contradictory_result = consistency_agent(consistency_query)
gap_result = gap_agent(gap_query)
synthesis_query = f"""Consolidate the following into a unified report:
Metric Results: {agent_responses['metric_result']}
Context Result: {agent_responses['context_result']}
Competitor Result: {agent_responses['competitor_result']}
Contradictory Analysis: {contradictory_result}
Gap Analysis: {gap_result}
"""
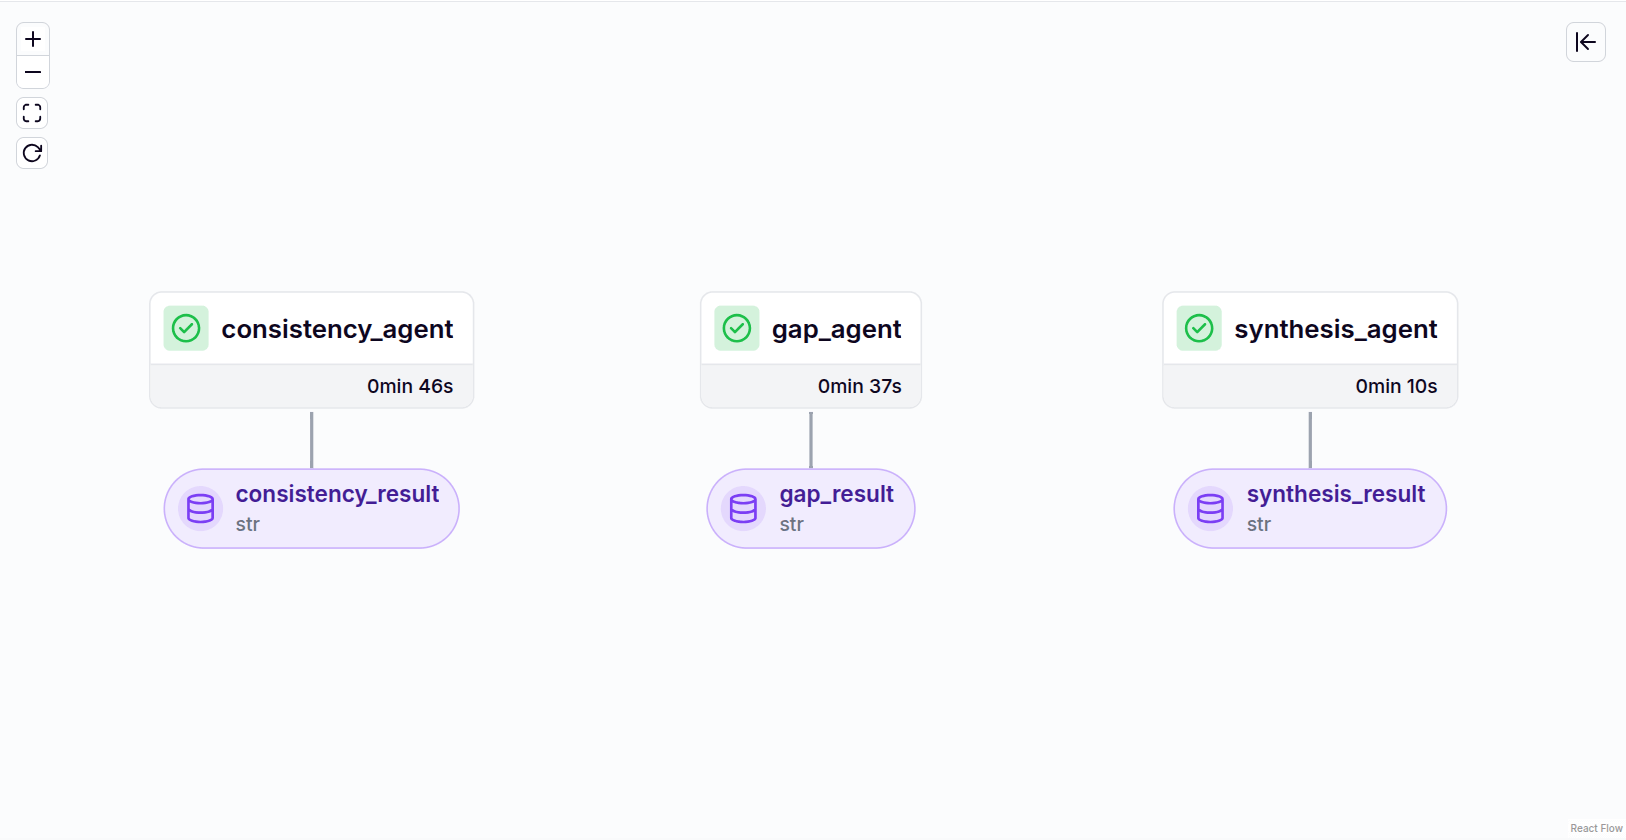
synthesis_result = synthesis_agent(synthesis_query)Similar to the agent analysis, here’s how the DAG looks like for agent validation:
Dashboard
A financial report is only as useful as its presentation. Raw data and insights, no matter how detailed, need a structured and visually accessible format to provide real value. In this section, we’ll build a simple dashboard that transforms extracted financial metrics and analysis reports into a well-organized HTML report.
At the core of this implementation is the financial_dashboard step, which takes a structured response containing financial insights and converts it into an interactive HTML dashboard. This step relies on utility functions to extract relevant data and generate HTML components for a clean, readable output.
Extracting Key Metrics
Before constructing the dashboard, we must parse the financial report’s response and extract key insights. The function extract_metrics() handles this by organizing the structured response into different categories: financial metrics, market context, competitor insights, contradictions, and additional context.
def extract_metrics(response: Dict[str, Any]) -> Dict[str, Any]:
    extracted_data = {
        "metrics": {},
        "context": {},
        "competitor": "",
        "contradictions": "",
        "additional_context": ""
    }

    task_outcome = response.get("### 2. Task outcome (extremely detailed version)", {})

    extracted_data["metrics"] = parse_financial_metrics(task_outcome.get("Metric Results", ""))
    extracted_data["context"] = task_outcome.get("Context Result", {})
    extracted_data["competitor"] = task_outcome.get("Competitor Result", "")
    extracted_data["contradictions"] = task_outcome.get("Contradictory and Gap Analysis", "")
    extracted_data["additional_context"] = response.get("### 3. Additional context (if relevant)", "")

    return extracted_data
This function retrieves specific components from the response, ensuring that each category is properly structured. Financial metrics are extracted separately using parse_financial_metrics(), which applies regex patterns to identify numerical values such as revenue growth rate, net margin, and debt-to-equity ratio.
def parse_financial_metrics(text: str) -> Dict[str, str]:
    metrics = {}

    patterns = {
        "Revenue Growth Rate": r"Revenue Growth Rate: ([\d\.%]+)",
        "Net Margin": r"Net Margin: ([\d\.%]+)",
        "Debt-to-Equity Ratio": r"Debt-to-Equity Ratio: ([\d\.%]+)"
    }

    for metric, pattern in patterns.items():
        match = re.search(pattern, text)
        if match:
            metrics[metric] = match.group(1)

    return metrics
With the data extracted and structured, the next step is transforming these insights into an HTML format.
Generating the Dashboard
The financial_dashboard step constructs an HTML report using ZenML’sHTMLString. It retrieves extracted data and then applies utility functions to format financial metrics and market context as structured HTML lists.
@step
def financial_dashboard(response: Dict[str, Any]) -> HTMLString:
    print(response)
    extracted_data = extract_metrics(response)

    html_content = f"""


        <div class="container">
            <h1>Financial Analysis Dashboard</h1>

            <h2>📊 Key Financial Metrics</h2>
            {generate_metrics_html(extracted_data["metrics"])}

            <h2>📰 Market Context</h2>
            {generate_context_html(extracted_data["context"])}

            <h2>🏆 Competitor Insights</h2>
            <p>{extracted_data["competitor"]}</p>

            <h2>⚠️ Contradictions & Gap Analysis</h2>
            <p>{extracted_data["contradictions"]}</p>

            <h2>📝 Additional Context</h2>
            <p>{extracted_data["additional_context"]}</p>

    """

    logger.info("Generated Financial Dashboard HTML.")
    return HTMLString(html_content)
To organize the metrics, competitors, and additional context, we’ll use an LLM to extract this information into a structured JSON format.
from models.models import ExtractedData
from config.prompts import EXTRACTION_SYSTEM_PROMPT, EXTRACTION_USER_PROMPT

def extract_metrics(response: Dict[str, Any], model: str = "gpt-4o-mini") -> Dict[str, Any]:
   input_text = prepare_input_text(response)
   try:
       response_obj = completion(
           model=model,
           messages=[
               {"role": "system", "content": EXTRACTION_SYSTEM_PROMPT},
               {"role": "user", "content": EXTRACTION_USER_PROMPT.format(input_text = input_text)}
           ],
           response_format=ExtractedData,
           temperature=0.1  # Low temperature for consistent extraction
       )

       extracted_data = json.loads(response_obj.choices[0].message.content)

       formatted_result = {
           "metrics": {
               k.replace('_', ' ').title(): v
               for k, v in extracted_data["metrics"].items()
               if v is not None
           },
           "context": extracted_data.get("context", {}),
           "competitor": extracted_data.get("competitor", ""),
           "contradictions": extracted_data.get("contradictions", ""),
           "additional_context": extracted_data.get("additional_context", "")
       }

       return formatted_result
This function constructs an HTML structure where each section presents a specific type of insight. The financial metrics and market context are rendered using helper functions like generate_metrics_html(), which wraps key values in styled HTML elements.
def generate_metrics_html(metrics: Dict[str, str]) -> str:
    if not metrics:
        return '<div class="no-metrics"><p>No financial metrics available.</p></div>'

    html = '''
    <div class="metrics-container">
        <div class="metrics-header">Financial Metrics</div>
        <div class="metrics-grid">
    ………
    '''

    for metric, value in metrics.items():
        html += f'''
        <div class="metric-card">
            <div class="metric-label">{metric}</div>
            <div class="metric-value">{value}</div>

        '''

    html += '''

    '''

    return html
Similarly, generate_context_html() follows the same approach for market insights.
def generate_context_html(context: Dict[str, Any]) -> str:
    if not context:
        return "<p>No market context available.</p>"

    html = "<ul>"
    for key, value in context.items():
        html += f"<li><strong>{key}:</strong> {value}</li>"
    html += "</ul>"
    return html
Encapsulating the dashboard logic in a ZenML step ensures that this visualization integrates smoothly into a broader analysis pipeline.
Integrating with the Pipeline
To incorporate the dashboard into the pipeline, we define a simple ZenML pipeline function that executes the financial_dashboard step. This pipeline orchestrates the flow from raw report data to a finalized HTML dashboard, making financial insights easily interpretable. Here’s how the report looks like in the dashboard:
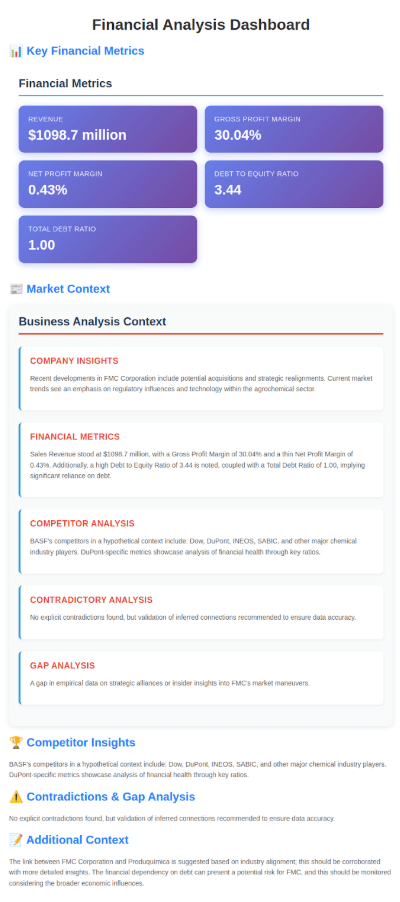
Here, we have a complete rundown of the complex workflows involving multiple agents with ZenML and SmolAgents.
Conclusion
The rise of vertical AI agents marks a new era in automating high-value tasks like financial report analysis. While a single LLM may struggle to process long documents and extract key insights, using multiple specialized AI agents can significantly enhance results.
This guide is a way out by building these applications effortlessly and with less pain. Using tools like ZenML and Langfuse, the system is more transparent to the engineer, so developers are comfortable reproducing the pipelines with evolving technologies.
Ready to start building your own AI pipelines? Sign up to ZenML today.
*Full code for the project is available at *https://github.com/haziqa5122/Financial-report-summarization-ZenML-and-SmolAgents