On this page
ZenML’s architecture has always prioritized simplicity and ease of deployment: a FastAPI server handling pipeline orchestration, backed by a SQL database for persistence. This design works well for most use cases, but as our users began running increasingly complex pipelines—particularly those with high parallelism and rich metadata—we identified several performance bottlenecks that needed systematic addressing.
<h2 class="zenml-title">ZenML's Simple Architecture</h2>


        FastAPI Server

    →

        SQL Database
Some enterprise customers reported API response times occasionally exceeding 30 seconds during peak loads, particularly when running pipelines with complex step dependencies and extensive metadata. These timeouts were triggering HTTP client failures and, in some cases, causing parallel pipeline steps to fail during execution.
Our v0.83.0 release addresses these performance issues through systematic database query optimization and FastAPI threading improvements. This post details our step-by-step investigation process, the specific bottlenecks we discovered, and the solutions we implemented to achieve significant performance improvements.
We write this in hopes that other engineering teams facing similar scaling challenges can learn from our systematic approach to performance optimization. The techniques we used—realistic load testing, systematic instrumentation, iterative problem-solving—are broadly applicable beyond ZenML to any system dealing with database bottlenecks and concurrent request handling.
Stage 1: The “Too Simple” Problem
Our performance investigation began with what seemed like a straightforward test: run 100 parallel pipeline steps and measure the results. We crafted a simple test pipeline where each step would perform minimal operations:
# Initial simple test pipeline
@step
def simple_step() -> None:
    time.sleep(5)  # Just sleep, minimal metadata

@pipeline
def simple_test_pipeline():
    for i in range(100):
        simple_step()
The results? Everything worked perfectly. But our users were still reporting problems.
The disconnect was stark: our synthetic tests passed while real-world usage failed. We realized our test pipeline was too simple—it didn’t reflect the complexity of actual ML workflows. Production pipelines involve significantly more complexity:
# Realistic test pipeline that exposed the issues
@step
def complex_step(
    input_1: int, input_2: str, input_3: float,
    # ... 20 total inputs
) -> Tuple[str, int, float]:
    # Add realistic metadata and tags
    step_context = get_step_context()
    step_context.add_tags(["env:production", "model:v2", "dataset:large"])

    # Simulate realistic API calls during execution
    client = Client()
    print("Starting API calls...")
    while time.time() - start_time < duration:
        # Perform various API operations
        print("Listing pipeline runs...")
        p = client.list_pipeline_runs()
        if p.items:
            print("Fetching pipeline run...")
            client.get_pipeline_run(p.items[-1].id)
        print("Listing stacks...")
        s = client.list_stacks()
        ...
        if sleep_interval > 0:
            print(f"Sleeping for {sleep_interval} seconds...")
            time.sleep(sleep_interval)

    return {
        "operations": operations,
        "duration": duration,
    }

@pipeline
def load_test_pipeline(
    num_parallel_steps: int, duration: int, sleep_interval: float
) -> None:
    result = init_step()
    for i in range(num_parallel_steps):
        load_step(
            duration,
            sleep_interval,
            *result,
            id=f"load_step_{i}",
        )
When we enhanced our test pipeline to include realistic complexity, performance issues became immediately apparent. Under load, some configurations experienced difficulties even with moderate parallelism (10+ concurrent steps), particularly when combined with rich metadata and frequent API interactions.
Stage 2: Enhanced Logging and Problem Identification
With realistic test conditions reproducing the issues, we needed better visibility into what was happening. We instrumented the server with detailed logging to capture performance metrics at REST API level and database level:
@app.middleware("http")
async def log_requests(request: Request, call_next: Any) -> Any:
    client_ip = request.client.host if request.client else "unknown"
    method = request.method
    url_path = request.url.path
    logger.debug(
        f"API STATS - {method} {url_path} from {client_ip} RECEIVED"
    )

    start_time = time.time()
    response = await call_next(request)
    duration = (time.time() - start_time) * 1000
    status_code = response.status_code

    logger.debug(
        f"API STATS - {status_code} {method} {url_path} from "
        f"{client_ip} took {duration:.2f}ms"
    )
    return response
# Enhanced logging for performance debugging
import logging
from contextlib import contextmanager
from sqlmodel import Session as SqlModelSession
class Session(SqlModelSession):
def __enter__(self) -> "Session":
self.start_time = time.time()
active_connections = db_pool.checkedout()
available_connections = db_pool.size() - active_connections
self.caller_method = "extract calling method from the stack trace"
logger.debug(
f"SQL STATS - '{self.caller_method}' started [ conn(active): "
f"{checked_out_connections} conn(idle): "
f"{available_connections} ]"
)
def __exit__(
self,
exc_type: Optional[Any],
exc_val: Optional[Any],
exc_tb: Optional[Any],
) -> None:
duration = time.time() - start_time
logger.debug(
f"SQL STATS - '{self.caller_method}' completed in "
f"{duration:.2f}ms"
)
# Usage in store methods
def get_run(self, run_id: UUID) -> PipelineRunResponse:
with Session(self.engine) as session:
# ... database operations
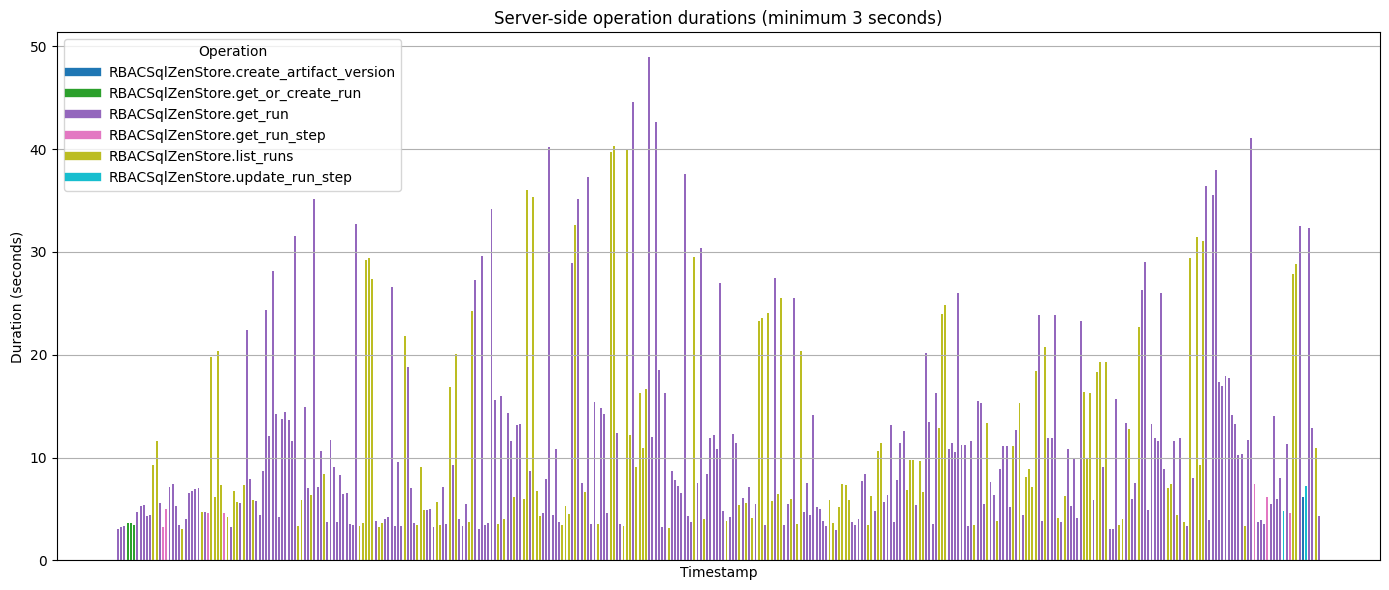
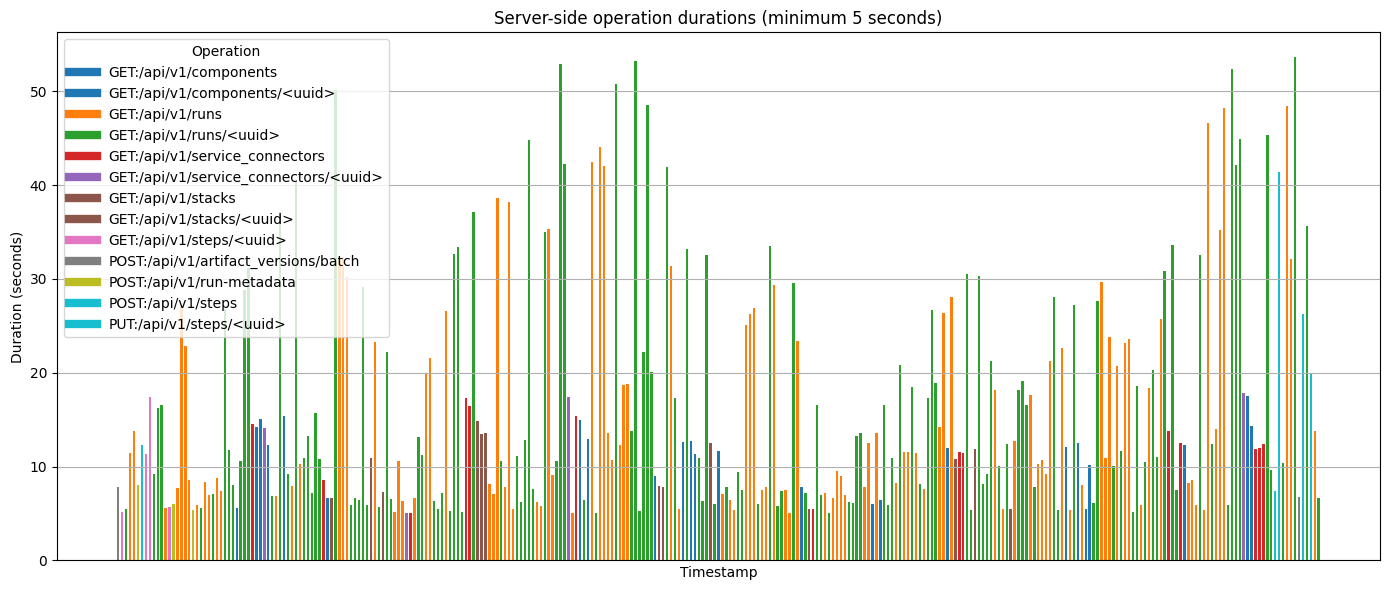
return runThe enhanced logging revealed the smoking gun. Database queries were the primary bottleneck:
Shell
# API endpoint response times (anything >30s causes client timeouts)
$ grep -oE 'INFO.*took [0-9]{5,9}\..*ms' server-logs.txt | head -n 5
76868.81ms: GET /api/v1/runs/26b0ea99-e608-4bb7-8734-67f9491e3773
71714.49ms: GET /api/v1/runs
70788.74ms: GET /api/v1/steps/e9080587-d74a-4c99-b9d9-022afa4d5756
63195.76ms: GET /api/v1/steps
55644.02ms: POST /api/v1/artifact_versions/batch

# Database operation breakdown
$ grep -oE 'INFO.*completed in [0-9]{2,9}.*seconds' server-logs.txt | head -n 5
48.908s: 'RBACSqlZenStore.get_run'
44.545s: 'RBACSqlZenStore.get_run'
42.680s: 'RBACSqlZenStore.get_run'
41.033s: 'RBACSqlZenStore.get_run'
40.272s: 'RBACSqlZenStore.list_runs'
We discovered that the expensive get_run operations were being called unnecessarily for authentication purposes, even when not explicitly requested by the client. Pipeline run fetching had become prohibitively expensive because it involved multiple SQLAlchemy queries to build complete objects with steps, artifacts, metadata, and relationships.
Stage 3: Database Query Optimization
Armed with specific data about the bottlenecks, we implemented comprehensive database optimizations.
Response Structure Refactoring
We analyzed which attributes were actually needed for different use cases and restructured our API responses:
# Before: Heavy pipeline run response
{
    "id": "26b0ea99-e608-4bb7-8734-67f9491e3773",
    "body": {
    "user": {...},  # Full user object
    "status": "completed",
    "pipeline": {...}
    },
    "metadata": {
    "project": {...},  # Full project object
    "steps": [
        # Unpaginated list of ALL steps
        {"id": "step1", "inputs": {...}, "outputs": {...}},
        {"id": "step2", "inputs": {...}, "outputs": {...}},
        # ... potentially hundreds of steps
    ],
    "step_substitutions": {...}  # Substitutions for all steps
    }
}
# After: Lightweight pipeline run response
{
"id": "26b0ea99-e608-4bb7-8734-67f9491e3773",
"body": {
"user_id": "user-uuid", # Just the ID
"project_id": "project-uuid", # Just the ID
"status": "completed",
"pipeline": {...}
},
"resources": {
"user": {...}, # Loaded only when hydrate=True
}
# Steps fetched separately via /runs/{id}/steps
# DAG visualization via /runs/{id}/dag
}We eliminated N+1 query patterns and implemented intelligent joins:
# Before: N+1 query pattern
def get_pipeline_run(run_id: UUID) -> PipelineRunResponse:
    run = session.get(PipelineRunSchema, run_id)
    # Separate query for each relationship - expensive!
    steps = session.query(StepRunSchema).filter_by(pipeline_run_id=run_id).all()
    for step in steps:
        step.inputs = session.query(StepRunInputSchema).filter_by(step_id=step.id).all()
        step.outputs = session.query(StepRunOutputSchema).filter_by(step_id=step.id).all()
    run.user = session.get(UserSchema, run.user_id)  # Another query
    return build_response(run, steps)
# After: Optimized with joins and selective loading
def get_pipeline_run(run_id: UUID, hydrate: bool = False) -> PipelineRunResponse:
query = session.query(PipelineRunSchema).filter_by(id=run_id)
if hydrate:
# Use joinedload only when explicitly requested
query = query.options(
joinedload(PipelineRunSchema.user),
joinedload(PipelineRunSchema.project)
)
run = query.first()
# Steps are fetched separately only when needed
return build_lightweight_response(run)Specialized Endpoints
We created targeted endpoints for specific use cases:
# New endpoint for DAG visualization - fetches minimal step data
@router.get("/runs/{run_id}/dag")
async def get_pipeline_run_dag(run_id: UUID) -> DAGResponse:
    # Only fetch step relationships, not full step details
    steps = zen_store().list_run_steps(
        run_id=run_id,
    )
    ...
    return build_dag_response(steps)
Initial Results
These optimizations brought significant improvements, but we weren’t done yet. We were now able to handle more complex workloads, but still hit issues at higher parallelism levels.
Stage 4: The FastAPI Threading Discovery
While our database optimizations helped, we still saw unexpected behavior under high load. To isolate remaining issues, we created a controlled experiment: a single server pod with one FastAPI thread, making 10 concurrent get_run calls to fetch the same pipeline run (measured baseline: ~2.5 seconds per query).
The expected behavior would be linear scaling: each subsequent call waiting for the previous one to complete. However, the actual results showed a different pattern:“
Output
Request started × 10

Total time: 2.75seconds
Total time: 25.40 seconds  # Everything waits for serialization queue
Total time: 25.41 seconds
Total time: 25.42 seconds
# ... all remaining responses around 25 seconds
This was a revelation about FastAPI’s internal behavior. When using synchronous endpoints, FastAPI executes the handler function in a worker thread, but also queues response serialization in the same threadpool:
# Before: Synchronous endpoint (problematic under load)
@router.get("/runs/{run_id}")
def get_pipeline_run(run_id: UUID) -> PipelineRunResponse:
    # This runs in a worker thread
    return zen_store.get_run(run_id, hydrate=True)

    # FastAPI queues response serialization in the same threadpool
With limited worker threads and many queued requests, response serialization tasks accumulate behind the handler tasks, creating a bottleneck.
FastAPI Threading Fix
The solution was to convert synchronous endpoints to async endpoints that manually dispatch to the threadpool:
def async_fastapi_endpoint_wrapper(
    func: Callable[P, R],
) -> Callable[P, Awaitable[Any]]:

    @wraps(func)
    async def async_decorated(*args: P.args, **kwargs: P.kwargs) -> Any:
        from starlette.concurrency import run_in_threadpool
        ...
        return await run_in_threadpool(decorated, *args, **kwargs)

        # FastAPI processes response serialization in the main asyncIO event loop

    return async_decorated

@router.get("/runs/{run_id}")
# After: The wrapper converts a synchronous endpoint into an asyncIO one
@async_fastapi_endpoint_wrapper
def get_pipeline_run(run_id: UUID) -> PipelineRunResponse:
    return zen_store.get_run(run_id, hydrate=True)
This ensures response serialization happens on the event loop rather than competing for worker threads. The results after the fix showed perfect linear scaling:“
# After: Linear scaling as expected
Total time: 2.02 seconds
Total time: 4.03 seconds  # Proper queue progression
Total time: 6.03 seconds
Total time: 8.04 seconds
Total time: 10.04 seconds
# ... continues linearly<h2 class="zenml-title">FastAPI Threading: Sync vs Async Endpoints</h2>
❌ Synchronous Endpoints (Problematic)
<strong>Worker Thread Pool</strong>
Handler + Serialization
Handler + Serialization
Handler + Serialization
Queued Requests...
Queued Serialization...
⚠️ Serialization competes for worker threads
✅ Async Endpoints (Optimized)
<strong>Worker Thread Pool</strong>
Handler Only
Handler Only
Handler Only
<strong>Event Loop</strong><br />
Response Serialization
✅ Perfect linear scalingStage 5: Comprehensive Model Optimizations
With both database queries and FastAPI threading optimized, we implemented the final round of model-level improvements. These focused on eliminating remaining inefficiencies:
Step Run Response Improvements
# Before: Problematic step response structure
    {
      "id": "step-uuid",
      "body": {
        "inputs": {
          "data": "artifact-1-uuid"  # Only one input per name!
        },
        "outputs": {
          "processed_data": "artifact-2-uuid"
        }
      }
    }
# After: Improved step response with proper multi-input support
{
"id": "step-uuid",
"body": {
"substitutions": {...} # Step-specific substitutions
},
"resources": {
"inputs": {
"data": [
"artifact-1-uuid",
"artifact-2-uuid" # Multiple inputs per name now supported
]
},
"outputs": {
"processed_data": "artifact-3-uuid"
}
}
}Artifact Producer Query Optimization
# Before: Inefficient producer run lookup
def get_artifact_producer_run(artifact_version_id: UUID):
    # This would loop through ALL runs associated with the artifact
    artifact = session.get(ArtifactVersionSchema, artifact_version_id)
    for run in artifact.runs:  # Potentially hundreds of runs
        if run.has_step_that_produced(artifact):
            return run
# After: Direct query optimization
def get_artifact_producer_run(artifact_version_id: UUID):
# Direct join to find the specific producer run
return session.query(PipelineRunSchema).join(
StepRunSchema
).join(
StepRunOutputSchema
).filter(
StepRunOutputSchema.artifact_version_id == artifact_version_id
).first()Stage 6: Retry Storm Prevention
Our final optimization addressed an unexpected amplification effect. When ZenML clients experience timeouts, they retry requests up to 10 times. Under heavy server load, these retries can amplify the problem:
# Problem: Client retry logic under load
class RestZenStore:
    @property
    def session(self) -> requests.Session:
        ...
        retries = AugmentedRetry(
            connect=5,
            read=8,
            redirect=3,
            status=10,
            allowed_methods=["HEAD", "GET", "PUT", "DELETE", "OPTIONS"],
            status_forcelist=[
                408,  # Request Timeout
                429,  # Too Many Requests
                502,  # Bad Gateway
                503,  # Service Unavailable
                504,  # Gateway Timeout
            ],
            other=3,
            backoff_factor=1,
        )
        self._session.mount("https://", HTTPAdapter(max_retries=retries))
        self._session.mount("http://", HTTPAdapter(max_retries=retries))
        ...
We implemented server-side request queue monitoring to proactively reject requests that would likely timeout:
# Solution: Proactive server-side queue management
from fastapi import HTTPException
import time

request_semaphore = Semaphore(server_config().thread_pool_size)

@app.middleware("http")
async def prevent_read_timeout(request: Request, call_next: Any) -> Any:
    try:
        # Here we wait until a worker thread is available to process the
        # request with a timeout value that is set to be lower than the
        # what the client is willing to wait for (i.e. lower than the
        # client's HTTP request timeout). The rationale is that we want to
        # respond to the client before it times out and decides to retry the
        # request (which would overwhelm the server).
        await wait_for(
            request_semaphore.acquire(),
            timeout=server_request_timeout,
        )
    except TimeoutError:
        return JSONResponse(
            {"error": "Server too busy. Please try again later."},
            status_code=429,
        )

    try:
        return await call_next(request)
    finally:
        request_semaphore.release()
Performance Results
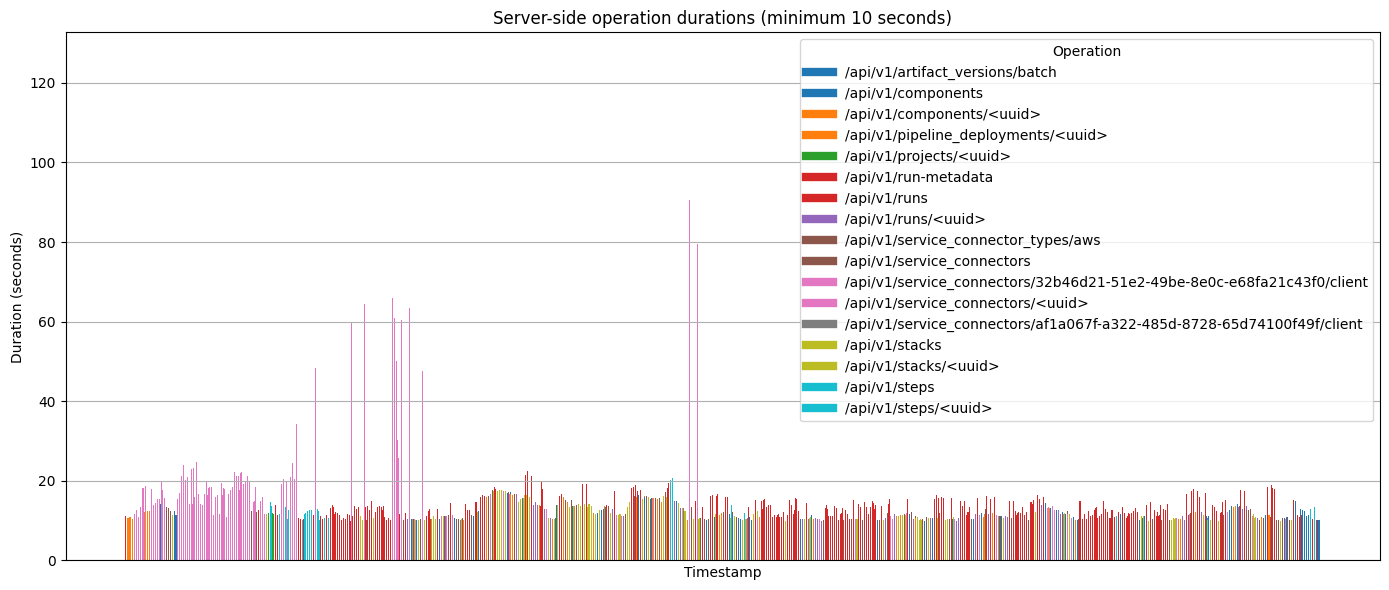
The combined optimizations produced dramatic improvements across all measured metrics:
**Database Query Performance:**Post-optimization, our worst-performing database operations completed in under 10 seconds, compared to previous peaks exceeding 40 seconds:“
$ grep -oE 'DEBUG.*completed in [0-9]{4,9}.*ms' final-test-logs.txt | head -n 5
8097.71ms: 'RBACSqlZenStore.list_runs'
8097.06ms: 'RBACSqlZenStore.list_runs'
8016.56ms: 'RBACSqlZenStore.list_runs'
7921.81ms: 'RBACSqlZenStore.list_runs'
7807.68ms: 'RBACSqlZenStore.list_runs'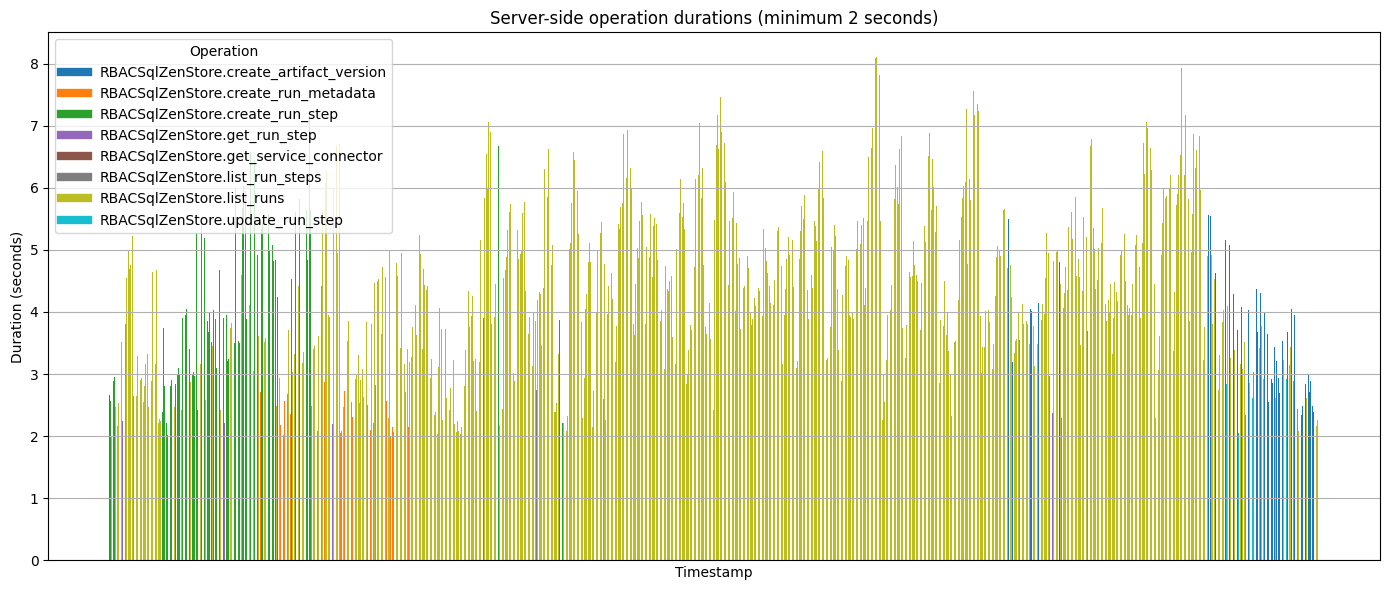
**Throughput Improvements:**Our performance testing framework now successfully runs 100+ parallel pipeline steps with complex metadata, compared to previous configurations that experienced difficulties with high-parallelism workloads under similar conditions. Our worse API call duration under load dropped below 20 seconds compared to the previous values exceeding 80 seconds.
**Resource Efficiency:**The optimizations also improved resource utilization, allowing the same workloads to run effectively with fewer server replicas. Our autoscaling configurations can now handle peak loads with reduced infrastructure requirements.
The Math:Moving from struggling with some 10+ parallel step configurations to smoothly handling 100+ parallel steps, combined with 20x database performance improvements, resulted in an overall 200x performance improvement for complex pipeline workloads.
Technical Insights
Iterative Problem-Solving Approach
Our step-by-step methodology proved crucial. Each stage built on the previous discoveries:
- Realistic testing exposed the problems
- Enhanced logging identified specific bottlenecks
- Database optimizations addressed the primary issues
- Controlled experiments revealed secondary bottlenecks
- Comprehensive optimizations eliminated remaining inefficiencies
- Monitoring prevented amplification effects
Framework Behavior Understanding
Understanding FastAPI’s threading implementation details was crucial for optimization. Similar performance characteristics likely exist in other async frameworks, making this analysis broadly applicable.
Response Design Impact
API response structure has direct performance implications. Separating heavyweight attributes into optional sections (resources) dramatically reduces default response times while maintaining flexibility.
Multi-Layer Performance Issues
Database optimization, threading behavior, and client retry logic all contributed to overall performance characteristics. Addressing these issues required coordinated changes across multiple system layers.
<h2 class="zenml-title">6-Stage Performance Optimization Methodology</h2>
1
The "Too Simple" Problem
Realistic testing with complex pipelines
→
2
Enhanced Logging
Instrument API & database performance
→
3
Database Optimization
Query optimization & response refactoring
4
FastAPI Threading Fix
Async endpoints & threading discovery
5
Model Optimizations
Step responses & artifact queries
6
Retry Storm Prevention
Server-side queue management & proactive rejection
200x
Overall Performance Improvement
20x
Database Queries
100+
Parallel Steps
<20s
API Response TimeConclusion
The optimizations implemented in ZenML v0.83.0 address the core performance bottlenecks we identified through systematic testing and analysis. The database query improvements, FastAPI threading optimizations, and retry logic enhancements work together to provide a 200x improvement in throughput for complex, parallel pipeline workloads.
Our iterative performance testing framework has become an integral part of our development process, enabling us to proactively identify performance regressions and validate optimizations under realistic load conditions.
These improvements provide substantial headroom for larger-scale ML workloads while maintaining ZenML’s ease of deployment and operation. For users running complex pipelines with high parallelism, extensive metadata, or frequent API interactions, these optimizations should significantly improve reliability and reduce timeout-related failures.
Get Started
Ready to experience the performance improvements? Upgrade to ZenML v0.83.0 today:
pip install --upgrade zenml… alongside updating your server image.
The performance improvements are immediately available—no configuration changes required. Your existing pipelines will run faster, and you’ll have the headroom to tackle much larger workloads.
Want to see the technical details? Check out our performance testing documentation and the optimization pull requests that made this possible.
The ZenML team is constantly working to make MLOps more scalable and reliable. Follow our GitHub repository for the latest updates, and join our Slack community to discuss performance optimization strategies with other ML engineers.