Last updated: November 3, 2022.
ZenML 0.5.4 adds visualizations for your native ZenML pipelines as well as several bugfixes and updates to our documentation (init docstrings galore!). We removed a dependency we no longer needed, which will make your pip installs much faster! For a detailed look at what’s changed, give our full release notes a glance. This blog post will cover the big change we’re introducing in the new version.
Pipeline Lineage Tracking & Visualization
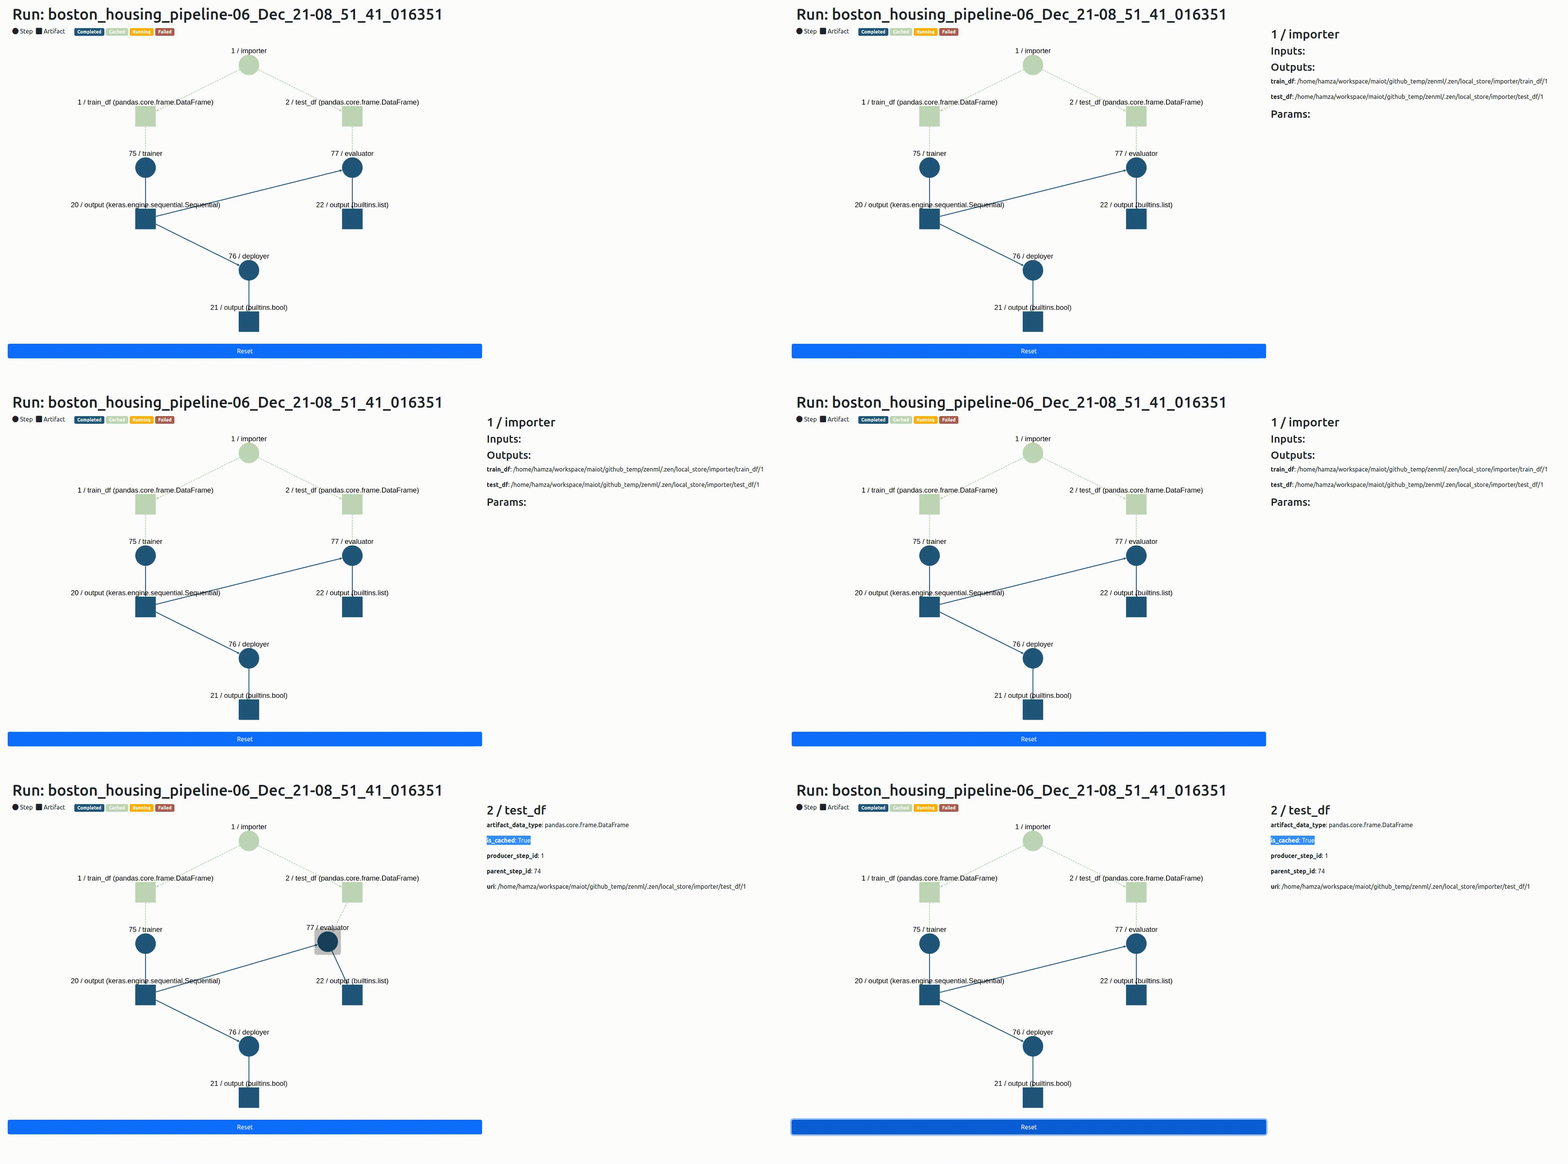
The statistics visualizations from the last release got us all inspired to add a few more useful ways of seeing what’s going on in your pipelines. It’s not uncommon for pipelines to be made up of many steps, and those steps can interact and intersect with one another in often complex patterns. We’ve built a way for you to inspect what’s going on with your ZenML pipeline:

Here’s what the pipeline lineage tracking visualizer looks like
You can see in this animated diagram that each of the steps and artifacts of the pipeline are represented as circles or squares respectively. We included a way to get a quick sense of the status of these elements through color: red shapes means that a step has failed, while blue and green show success. (Orange means your step is still running in the orchestrator).
We’re also really excited that you can see whether a particular step or artifact is cached or not. (Watch this space for a blog coming soon on the benefits of caching!) On the right-hand side of the chart, you can view metadata about the particular step or artifact, including information about the step’s lineage and so on.
Contribute to ZenML!
Join our Slack to let us know what you think we should build next!
Keep your eyes open for future releases and make sure to vote on your favorite feature of our roadmap to make sure it gets implemented as soon as possible.
[Image credit: Photo by Luca Upper on Unsplash]


