On this page
Observability is the bedrock of reliable software. And for years, Datadog has been the name for full-stack monitoring. And we don’t doubt that. No one does.
But at the pace ML and LLM applications are growing, you’ll find Datadog struggling with the new-age observability needs.
The very features that make Datadog a powerful generalist can create specific pain points. Think of runaway costs and a monitoring model that’s brilliant for infrastructure but lacks the model-centric insights required for AI.
If you’re an ML engineer or developer feeling this friction, you’re not alone. We’ve been there. That’s why we tried and tested the seven best Datadog alternatives, each built to address these new, complex observability challenges.
TL;DR
- Why Look for Alternatives: At ML and LLM scale, Datadog’s costs can spike, especially with high log and custom metric volumes, and its general-purpose design lacks the depth, model-centric observability (like hallucination or drift detection) that AI applications require.
- Who Should Care: This guide is for ML engineers, Python developers, MLOps teams, and platform leads who need more predictable pricing, deeper AI-specific insights, or more flexible data handling than what Datadog offers.
- What to Expect: We tried and tested 7 Datadog alternatives. Each alternative was tested using a proven evaluation criterion. We broke down each by features, pricing, and real-world pros/cons, so you can identify which fits your stack and budget.
The Need for a Datadog Alternative?
Datadog’s core observability fields: logs, metrics, and traces, have long set a standard for monitoring cloud-native applications. But the rise of AI and LLM systems introduces a new kind of telemetry. And with all respect, Datadog doesn’t fit neatly into this model.
1. Runaway Cost at ML/LLM Scale
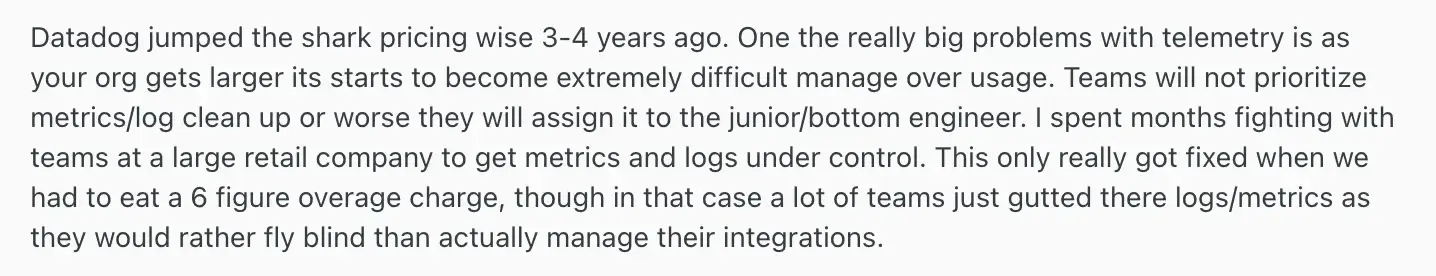
ML systems are chatty. A single RAG pipeline can generate thousands of events, traces, and large text logs for every query. Datadog’s billing model for log ingestion and custom metrics can escalate quickly as data volume, cardinality, and retention grow. Users often report ‘sticker shock.’ For example, they hit a whopping six-figure monthly bill due to logs and metric cardinality.
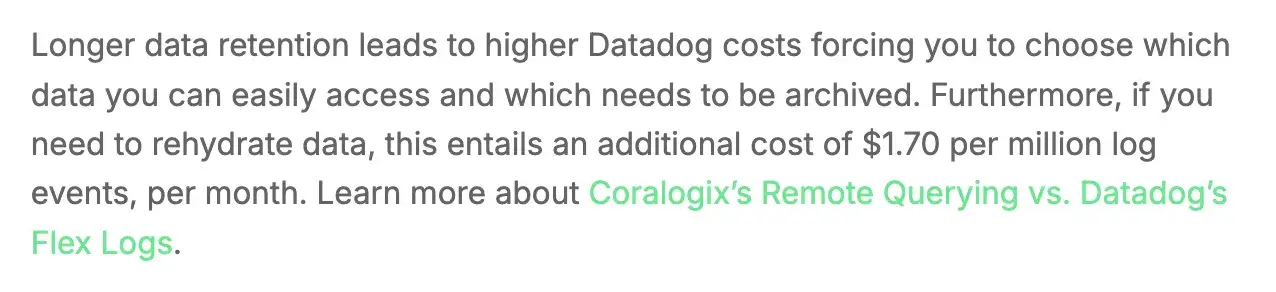
2. Retention vs Governance Needs
In the context of LLMs, model audits and drift analysis require long-term retention of prompts and outputs. In contrast, Datadog’s pricing models are often optimized for short-term infra debugging.
If you’re about to use Datadog or already using it for LLM observability, you’ll find the cost rising as you extend logging and search. HN threads also call out extra charges for archive or rehydrate workflows.
In short, teams needing months or years of data for compliance or analysis face a tough choice. Pay steeply or archive data externally and lose easy searchability.
3. Great infra APM, thinner model-centric depth
Datadog excels at infra health. ML/LLM adds needs like eval dataset management, lineage across prompts and datasets, semantic drift clustering, and hallucination scoring at scale.
Datadog now has LLM Observability and Experiments, yet many teams still want to explore tools that emphasize prompt-level analysis or dataset drift beyond generic telemetry.
As one Reddit user put it, Datadog is a ‘jack-of-all-trades,’ not built from the ground up for ML. It handles basic LLM metrics but doesn’t fully address prompt debugging or detailed tracing of model decisions.
Evaluation Criteria
To find the best Datadog alternatives, we evaluated each tool against four criteria that matter most for ML-centric observability:
- Model and LLM observability depth: We looked for features explicitly built for AI, such as RAG pipeline visualization, prompt and response logging, hallucination detection, semantic drift analysis, and built-in evaluation frameworks.
- Telemetry ingest and data handling: We assessed the support for OpenTelemetry, flexibility in sampling and filtering, and the ability to ingest and analyze complex data types, such as text embeddings, without rigid schemas.
- Cost and predictability: We favored tools with predictable, usage-based pricing that doesn't penalize teams for high-cardinality data or long-term retention. We looked for generous free tiers and open-source options.
- Integration with your ML stack: We prioritized platforms that integrate natively with Python, Kubernetes, and popular ML frameworks like LangChain, LlamaIndex, and standard experiment trackers.
What are the Best Alternatives to Datadog
Here is a quick summary of the seven best Datadog alternatives we tested:
| Datadog Alternative | Best For | Key Features | Pricing |
|---|---|---|---|
| ZenML | ML and LLM teams that want to unify pipeline orchestration, model tracking, and observability within one open-source framework. | - End-to-end pipeline observability - Integrated monitoring for ML and LLM workflows - Data and model lineage - Extensive integrations | Free and paid (enterprise) |
| Braintrust | AI teams evaluating and monitoring LLM quality and prompt performance | - Real-time LLM performance monitoring - Automated evaluation workflows - Prompt and model versioning | - Free tier (up to 1 million spans) - Pro $249/month |
| LangSmith | LangChain developers and teams needing traceability for LLM applications | - Full-stack LLM tracing and debugging - Batch evaluations and feedback collection - Prompt version comparison UI | - Free developer tier - Plus $39/user/month |
| Arize Phoenix | ML and LLM teams seeking open-source, self-hosted observability and evaluation | - Local-first LLM tracing and debugging - Evaluation toolkit for LLM outputs - Drift detection and trace clustering | - Free (open-source) - Enterprise |
| Elastic Observability | Engineering teams needing a self-hosted ELK stack for logs, metrics, and traces | - Kibana dashboards and custom visuals - ML-based anomaly detection - Open data storage and retention control | - Free basic license - Elastic Cloud pay-as-you-go |
| IBM Instana | Enterprises needing automated APM and real-time tracing with on-prem options | - Automatic service discovery and mapping - 100% trace capture (no sampling) - AI-based incident detection | Custom pricing |
| Chronosphere | Cloud-native teams optimizing observability cost and data volume | - High-scale metrics ingestion - Data shaping and downsampling controls - Prometheus and OpenTelemetry compatible | Custom pricing |
1. ZenML
Best For: ML and LLM teams that want to unify pipeline orchestration, model tracking, and observability within one open-source framework.
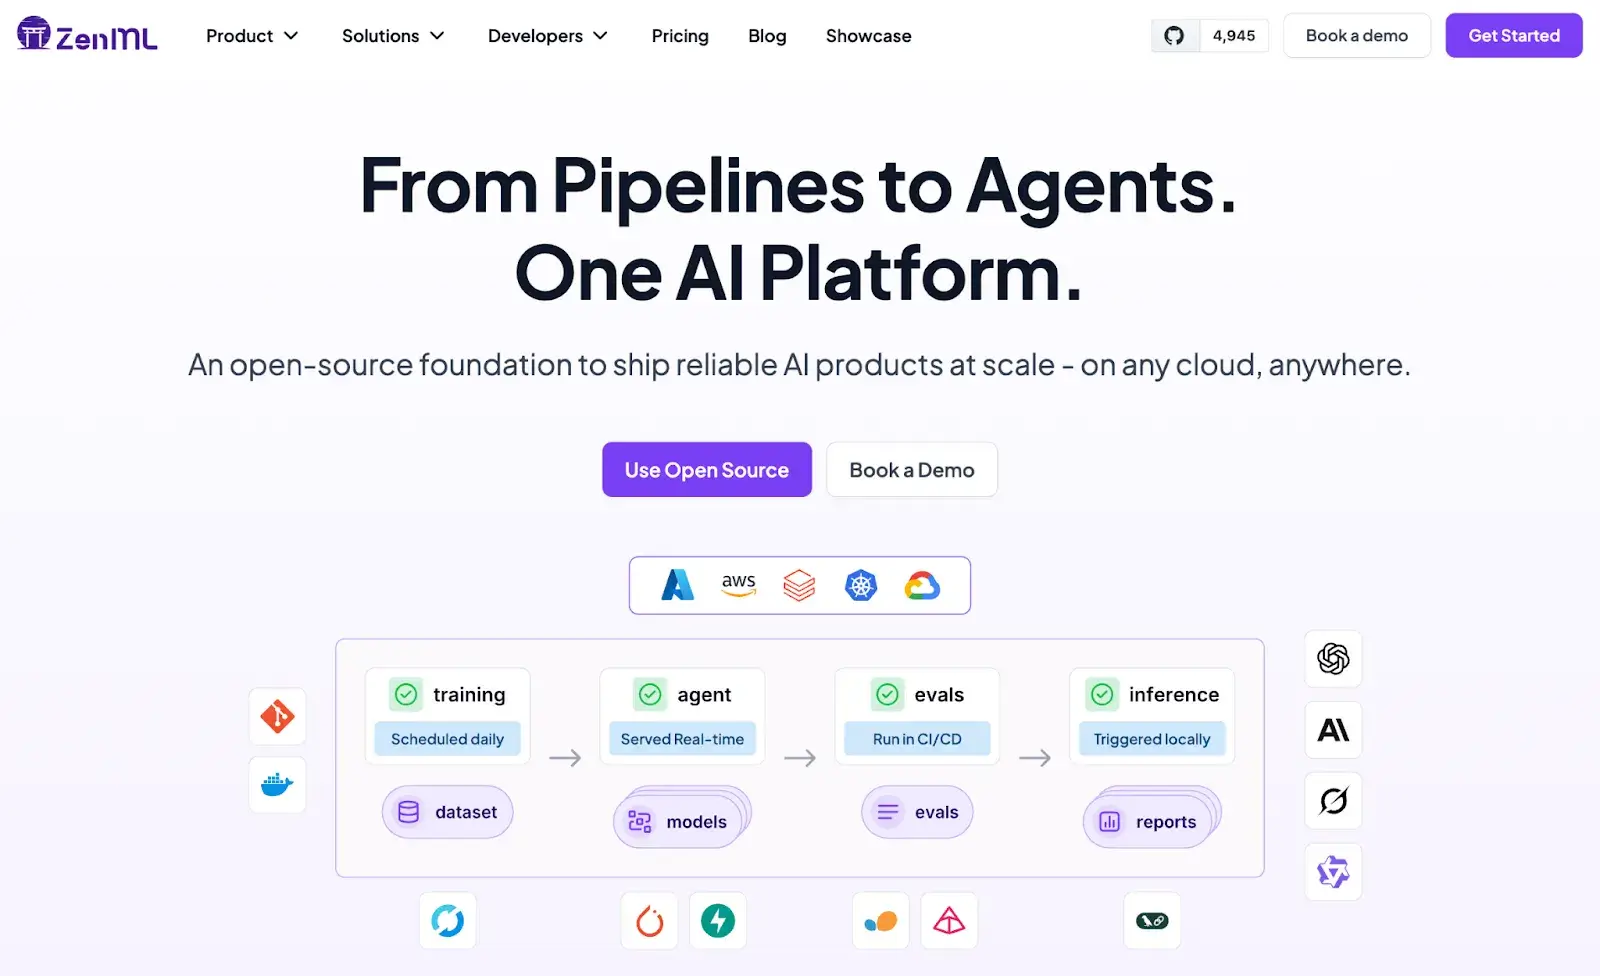
ZenML is an open-source MLOps and LLMOps framework that can partially replace Datadog for model-centric observability, not for traditional infrastructure or application monitoring. While Datadog focuses on logs, metrics, and traces for servers and apps, ZenML focuses on pipelines, experiments, and lineage for ML and LLM systems.
If your team’s observability needs center on tracking data drift, model performance, RAG pipeline evaluation, and lineage visibility, ZenML can cover those use cases. However, for APM, distributed tracing, or server metrics, you’ll still need Datadog or similar tools like Prometheus or Grafana.
Features
- End-to-end pipeline observability: Track every pipeline run, artifact, dataset, and model version from training to deployment.
- Integrated monitoring for ML and LLM workflows: Visualize pipeline health, model performance, and drift metrics with built-in experiment tracking.
- Data and model lineage: Automatically logs every dataset, parameter, and artifact to make debugging and audits straightforward.
- Extensive integrations: Supports integrations with tools like Evidently, LangChain, LlamaIndex, and OpenAI for drift detection, RAG evaluation, and LLM observability.
- Metadata and trace storage: Captures metadata, evaluation results, and artifacts for every experiment in a central dashboard, acting as your ML observability backend.
- Customizable stack: Works with your preferred orchestrators (Airflow, Kubeflow, Vertex AI, etc.) and experiment trackers, giving flexibility that Datadog lacks in ML pipelines.
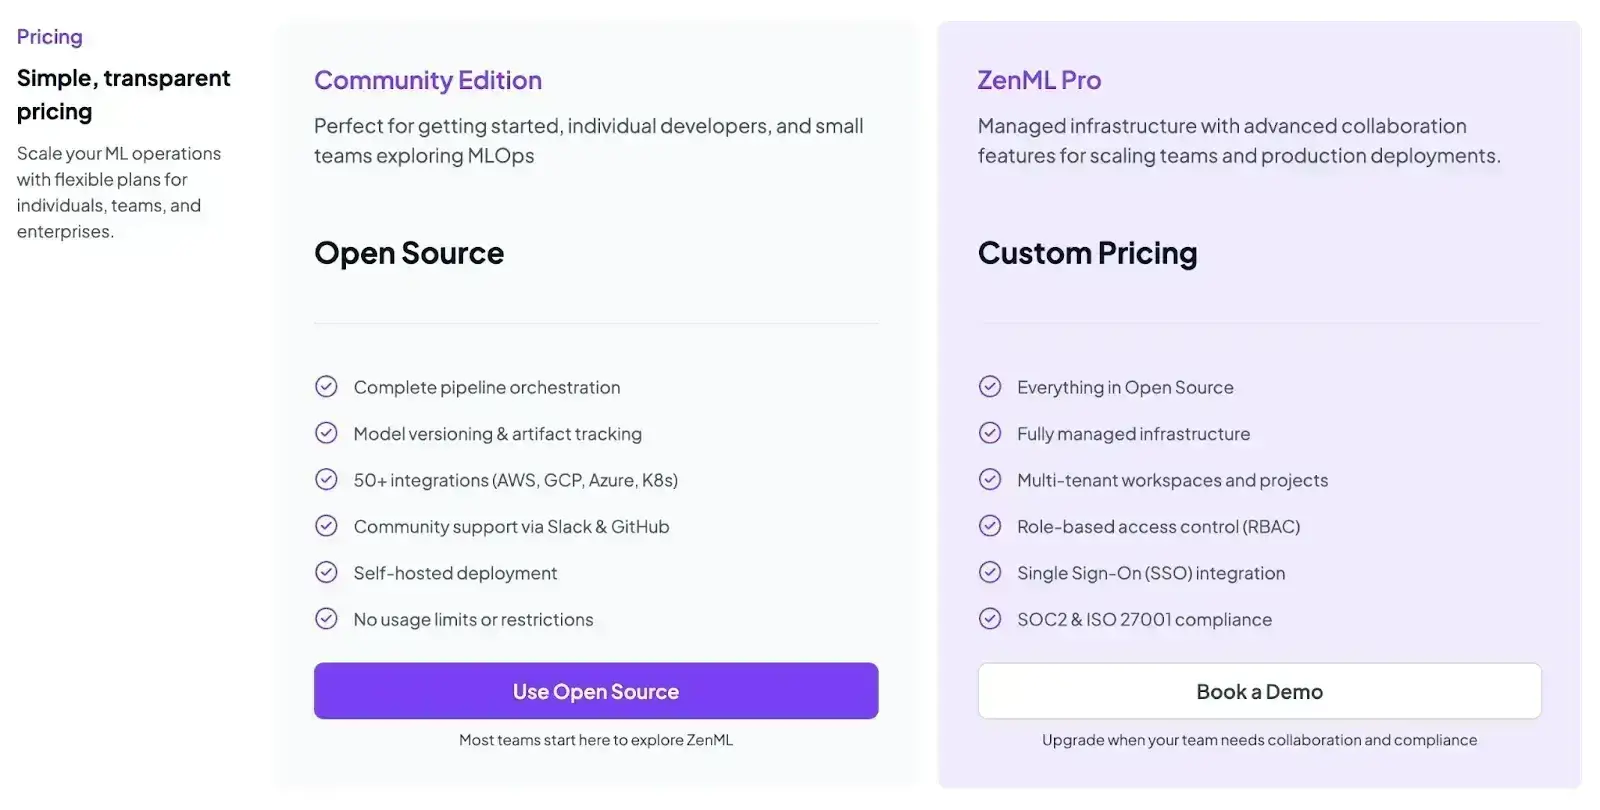
Pricing
ZenML is free and open-source under the Apache 2.0 license. The core framework and dashboard are fully available without cost.
For teams needing enterprise-grade collaboration, managed hosting, and premium support, ZenML offers custom business plans. These are typically usage- or seat-based and are tailored depending on your deployment model (cloud or on-prem).
Pros and Cons
ZenML’s biggest advantage is its deep integration within the ML lifecycle, something Datadog doesn’t natively offer. You can orchestrate, monitor, and evaluate every part of your ML or LLM pipeline without leaving your stack. It’s highly flexible, open-source, and ideal for teams who want full control of their observability workflows at the model level.
However, ZenML doesn’t replace Datadog’s infrastructure observability; you won’t get application traces, server health metrics, or distributed logging out of the box.
2. Braintrust
Braintrust is an AI-native observability and evaluation platform designed for LLM applications. It shifts the focus from generic logging toward a ‘test-driven’ workflow for LLMs: you can benchmark prompt/model changes, automate evaluations, and monitor quality over time.
Features
- Create and run ‘evals’ (evaluations) that test your application's prompts, models, and RAG configurations against predefined datasets.
- Track live model responses for latency, token usage, error rates, and even define domain-specific quality metrics in production
- Use the ‘Brainstore,’ a purpose-built storage backend designed for AI data (logs, traces, evals) that allows for fast, complex queries that traditional log databases struggle with.
- Offers an interactive testing playground where teams or departments can try prompt variations and compare results side-by-side.
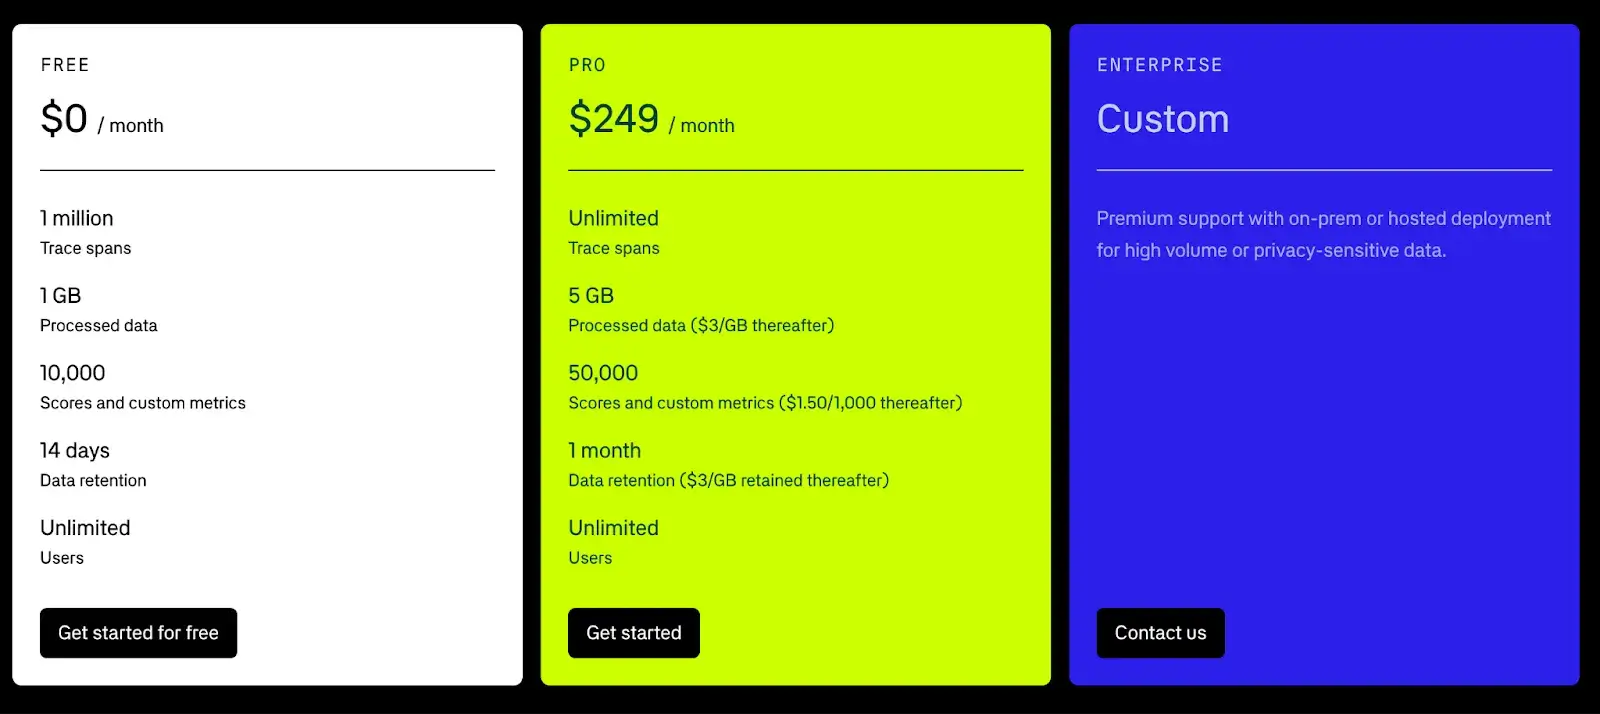
Pricing
Braintrust offers a generous free forever plan. The Free tier allows up to 1 million trace spans and 10,000 scores/metrics per month.
Other than that, Braintrust has two paid plans:
- Pro: $249 per month
- Enterprise: Custom
Pro and Cons
Braintrust’s UI is approachable for both engineers and non-engineers. The platform’s strongest suit is evaluation: teams rave about systematically catching regressions before they hit production. It’s less of a full-stack APM and more of a specialized CI/CD and monitoring tool for your AI’s quality and behavior.
On the contrary, self-hosting is only for Enterprise, and relying on the SaaS model might be a concern if your system is filled with sensitive data. Also, Braintrust is not too focused on cost analytics or low-level infrastructure metrics. So you might still pair it with an infra monitor for things like CPU/memory.
3. LangSmith
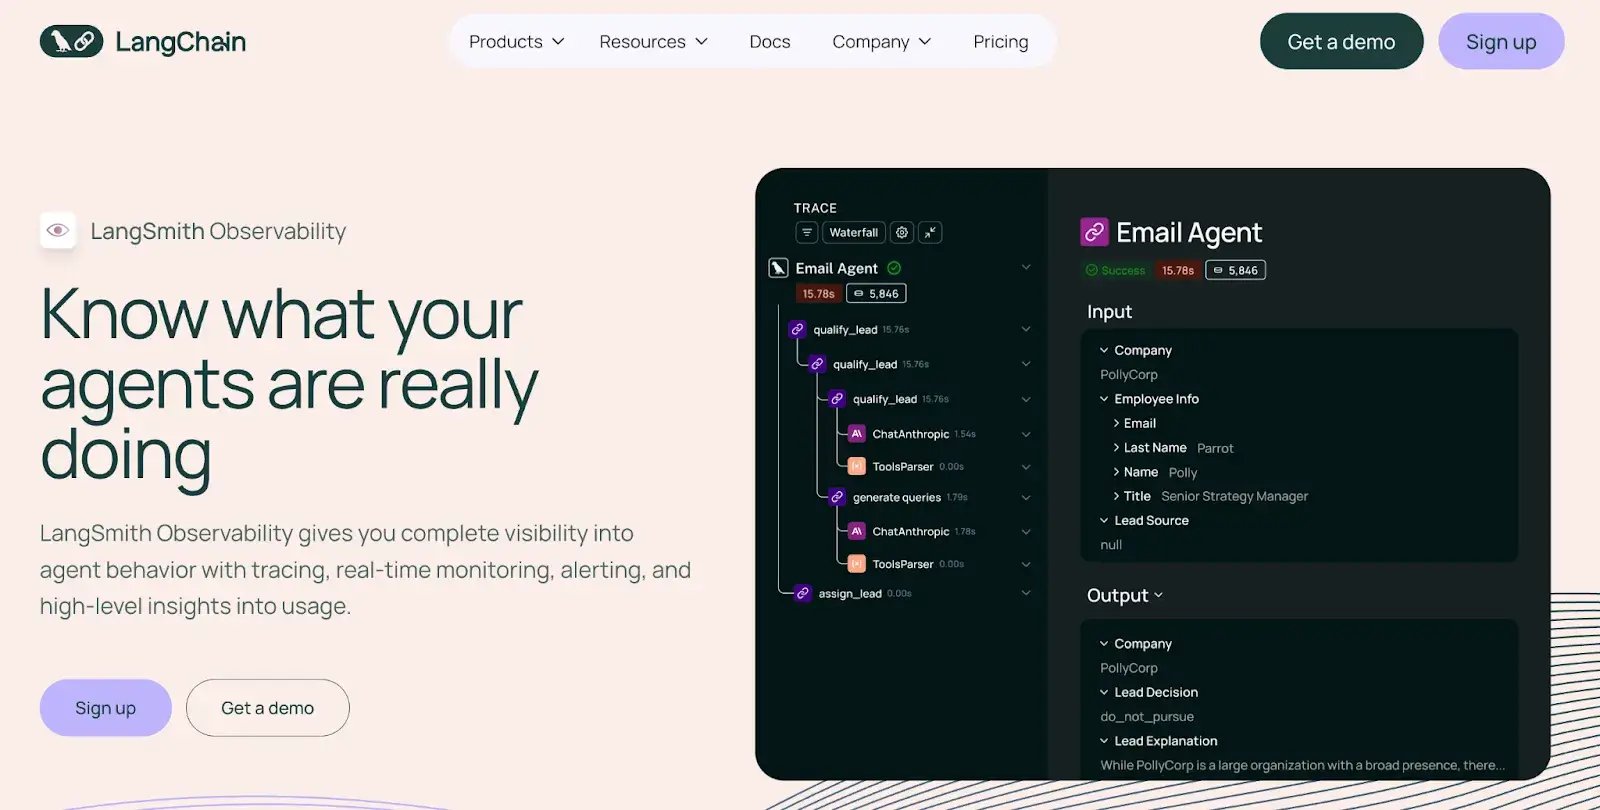
LangSmith is an observability and evaluation platform from the creators of LangChain, built to debug, monitor, and test LLM applications. It provides full-trace visibility into every step of your agent or chain, making the ‘black box’ of complex LLM calls transparent.
Features
- Captures every LLM call, function call, and tool usage within your application and displays it in a detailed, hierarchical trace.
- Use visual dashboards to track cost, latency, token usage, and feedback scores for your applications in real time.
- Evaluate outputs at scale with batch runs that use an LLM-as-judge or human review, logging every score to build a labeled quality dataset.
- Compare outputs from different prompt versions or parameters side by side in the UI without having to write custom scripts.
- Has native OTel support, allowing you to send LangSmith traces to other observability tools (including Datadog) to unify your stack.
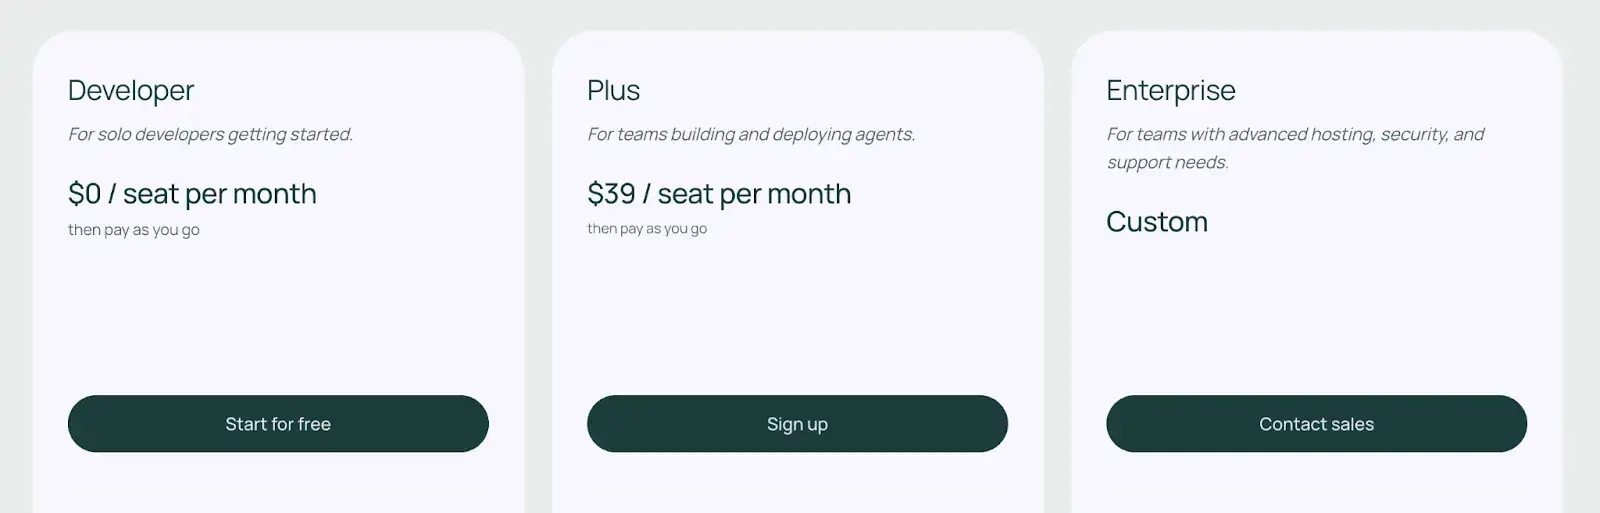
Pricing
LangSmith offers a free Developer Plan for individual use. Apart from that, it has two paid plans:
- Plus: $39 per seat per month
- Enterprise: Custom pricing
Pros and Cons
LangSmith’s biggest pro is its deep, native integration with the LangChain ecosystem. If you’re building with LangChain or LangGraph, it’s the path of least resistance to world-class observability. It’s also framework-agnostic via OTel, meaning you’re not forced into LangChain if you want to adopt it.
While LangSmith has a UI, it’s still code-centric in setup – non-developers will rely on engineers to instrument the app and define what to log. Also, it won’t monitor your databases or Kubernetes cluster, so it’s a complement to, or partial replacement for, Datadog’s APM, not its infrastructure monitoring.
4. Arize Phoenix
Arize Phoenix is an open-source library for ML observability that runs in your own environment (like a Jupyter notebook or script). It’s designed to help you find and fix problems with your LLM, RAG, and computer vision models during development before they ever reach production.
Features
- Instrument your LLM app locally to trace executions directly in a Jupyter notebook or web app, enabling private, offline debugging without sending data to the cloud.
- Leverage full OpenTelemetry support to send spans from LangChain, LlamaIndex, or custom code to Phoenix or any backend.
- Evaluate model outputs with an integrated toolkit that supports offline LLM-judge scoring, custom evaluators, and online A/B testing to score your model's outputs for correctness, toxicity, and relevance.
- Has built-in tools to visualize and explore embedding data, visualize retrieved document chunks, find clusters, outliers, and potential data quality issues.
- Debug issues efficiently with built-in latency heatmaps, drift detection, and trace clustering tools that help identify outliers and root causes across runs.
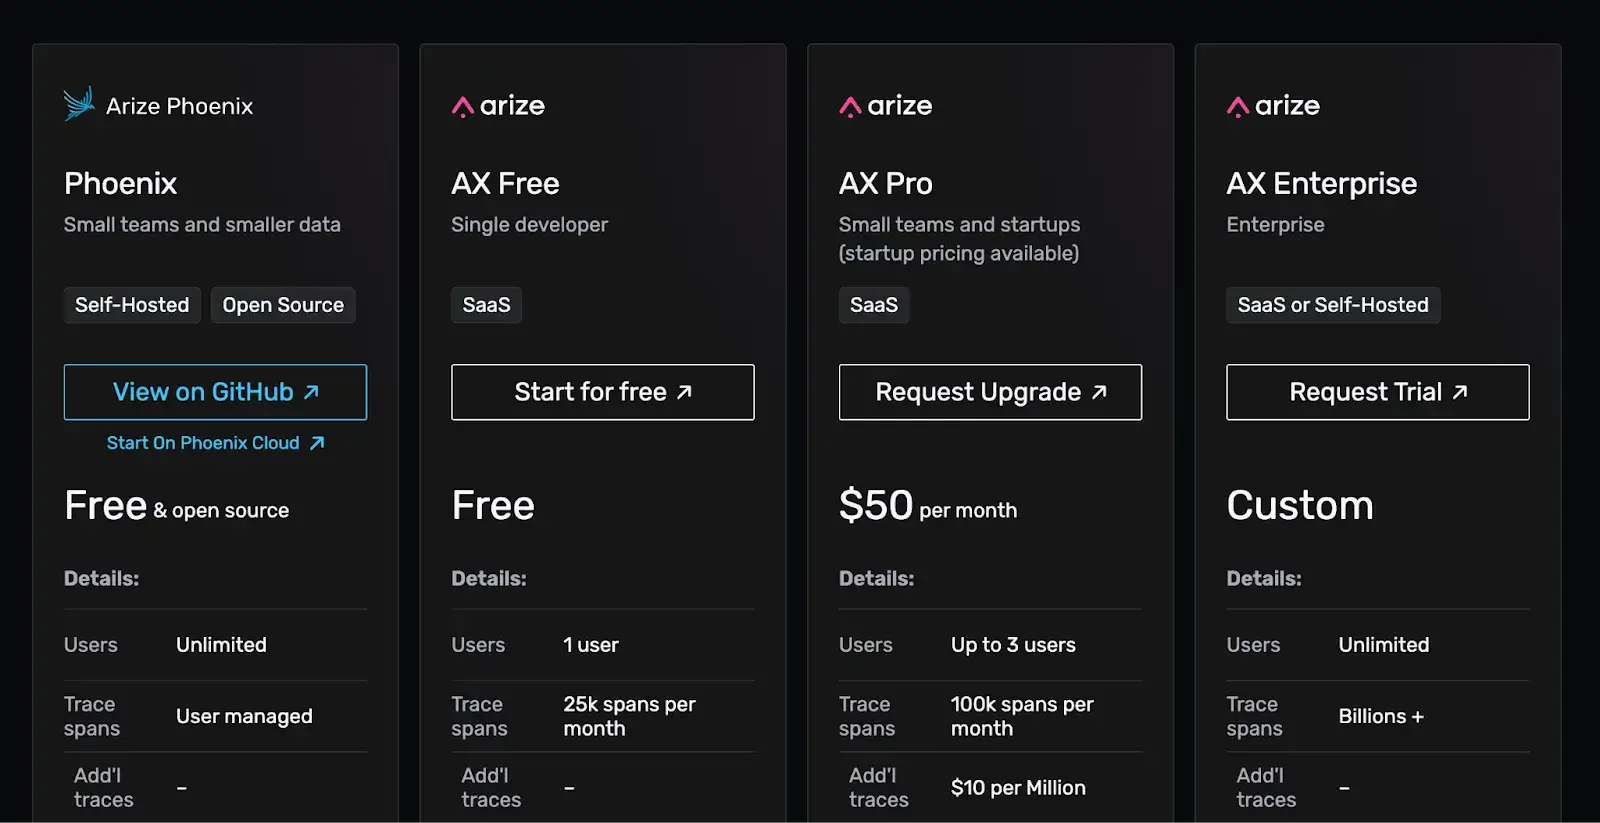
Pricing
Arize Phoenix is completely open-source and free. Arize also offers Pro ($50 per month) and Enterprise (Custom pricing) with added benefits and features.
Pros and Cons
Phoenix’s main strength is its developer-first, open-source nature. ML engineers love its notebook-native experience. You can run it alongside your development and get rich visualizations as you iterate. Being open source, it’s highly customizable and easily integrated into custom workflows without restrictions.
The trade-off is a steep learning curve. It’s geared toward power users. Those who want to slice and dice data. It’s not a persistent, at-scale production monitoring dashboard like Datadog. Also, as a young open-source project, you might hit occasional rough edges and will rely on community support unless you pay for Arize.
5. Elastic Observability
Elastic Observability is the monitoring solution built on top of the powerful Elastic Stack (formerly ELK). It unifies logs, metrics, and APM traces in one searchable datastore, making it a formidable and flexible open-source alternative to Datadog.
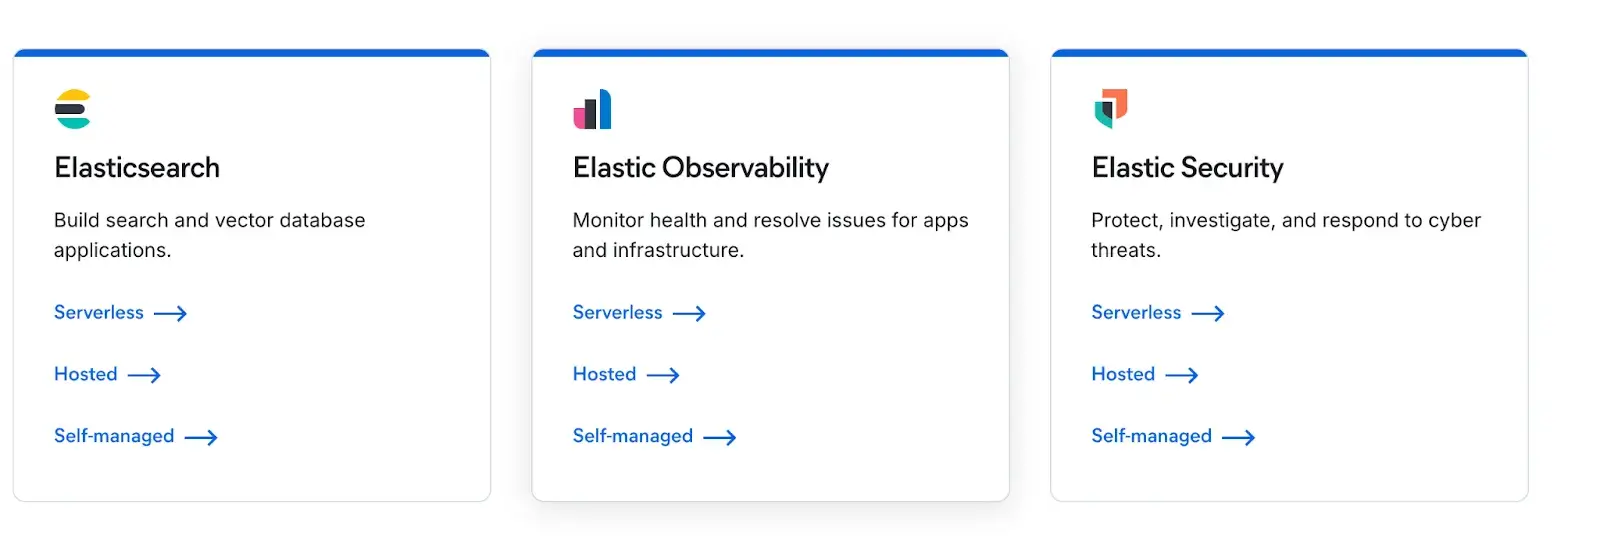
Features
- Collect logs, metrics, and traces from any source using Elastic APM agents or OpenTelemetry, and correlate them in one place.
- Build interactive dashboards in Kibana to visualize metrics, logs, and ML data with pre-built templates or custom insights into application and model performance.
- Use Elastic’s built-in machine learning models to detect anomalies, seasonality, and outliers in your data.
- Provides out-of-the-box monitoring for servers, Kubernetes, cloud services, and application performance (APM) with support for OpenTelemetry.
Pricing
Elastic’s pricing depends on how you use it.
- The stack is open-source and free to use for basic features.
- If you self-host, your cost is infrastructure + any X-Pack features you enable.
- Elastic Cloud (their hosted service) typically charges by resource consumption.
As a ballpark, log ingestion might be ~$0.10/GB, similar to Datadog, but you have the flexibility to only pay for the components you use.
👀 Note: Actual rates vary by region and tier.
Pros and Cons
Elastic’s biggest advantage is its powerful, unified search and flexibility. Because it’s built on Elasticsearch, it’s exceptional at log analytics and can handle any data you throw at it.
The main con is its complexity. Managing a self-hosted Elastic cluster is a significant operational burden, and even in the cloud, its query language (KQL) and numerous features present a steeper learning curve than Datadog’s more guided experience.
6. IBM Instana Observability
IBM’s Instana Observability, often just called Instana, is an enterprise-grade APM and observability platform. Instana specializes in automatic discovery and instrumentation. When you install it, it auto-detects all your services, applications, and their dependencies with minimal setup.
Features
- Supports full-trace capture without default sampling and allows linking them with metrics and profiles to give full visibility into every request’s journey through your system.
- Correlate logs with traces directly in the UI, letting you jump from slow or failing requests to relevant logs for instant context during troubleshooting.
- Detect incidents automatically using AI-based analysis, and pinpoint root causes by examining dependency graphs and event timelines across your environment.
- Visualize how all your services and infrastructure components are connected and communicate in real time using real-time dependency maps.
- Use AI to correlate event traces and intelligent root cause analysis, automatically identifying the likely root cause of incidents.
Pricing
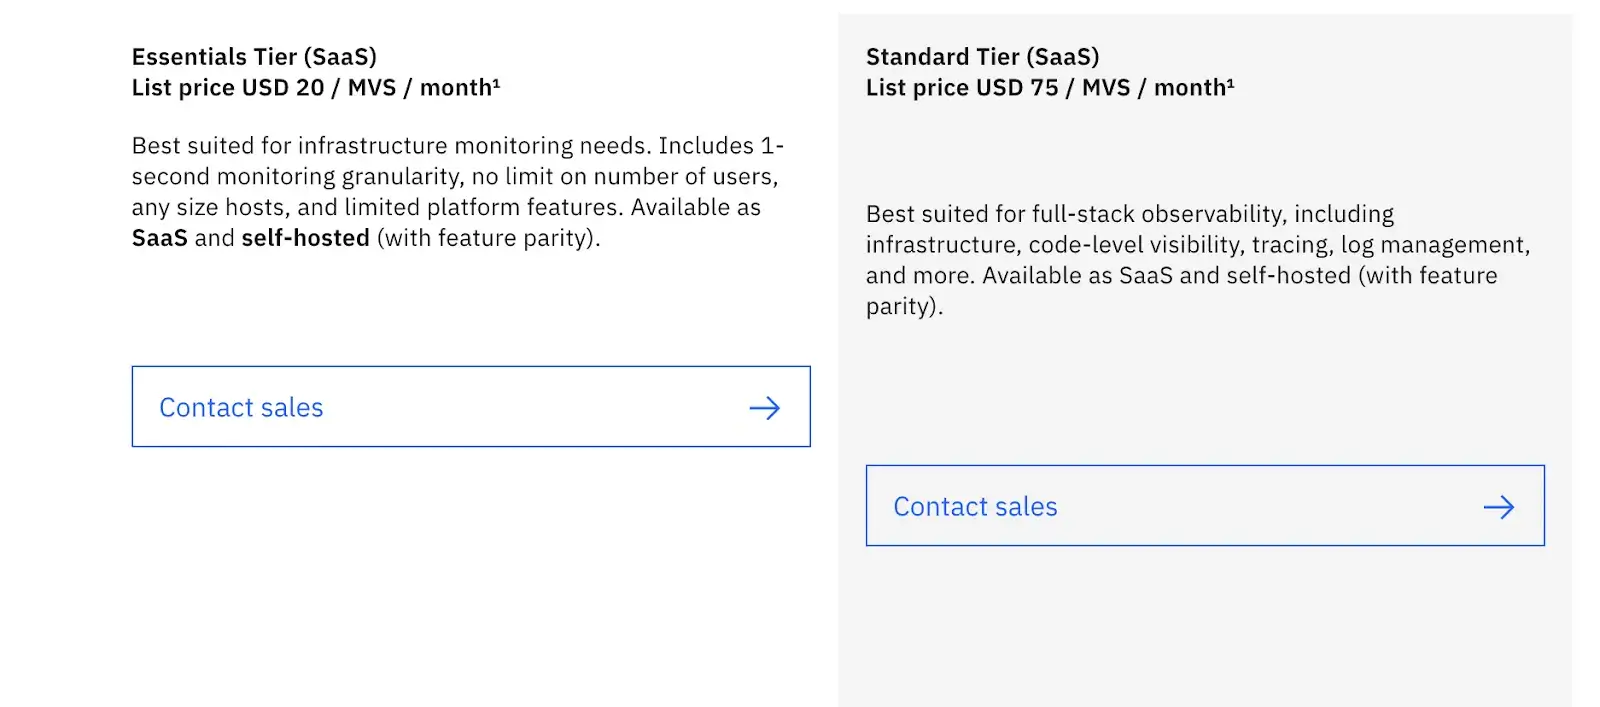
Instana is priced per host, with both SaaS and self-hosted options available. Pricing is generally aimed at enterprise-level customers. So you must connect with their sales team to get a quote.
Pros and Cons
Like we said, Instana is praised for ease of setup. In minutes, it starts showing insights without heavy configuration. Its data is truly real-time, which is crucial for catching spikes. The unified agent means less agent overload on your hosts. Users also appreciate the built-in knowledge base of performance issues.
The downside is cost and complexity. Pricing per host can become steep if you have a large Kubernetes cluster with many small pods. Capturing 100% of data is expensive, and the platform is a heavyweight enterprise tool. Its LLM-specific observability features are also less mature than specialized tools.
7. Chronosphere
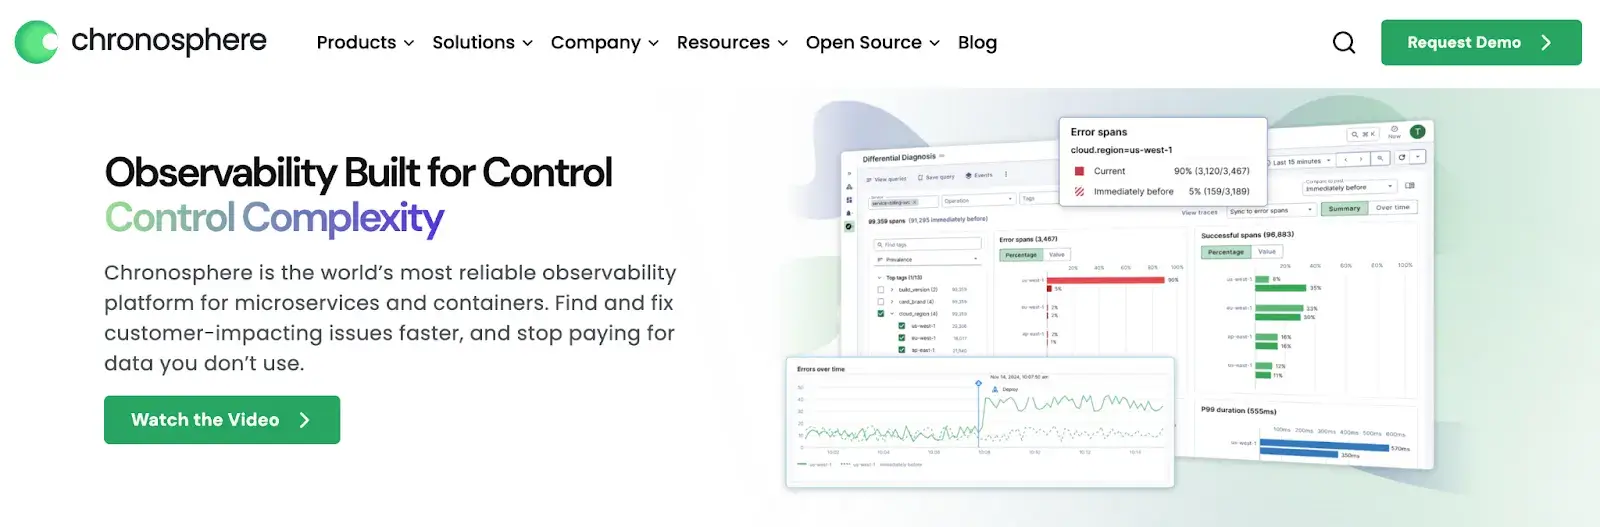
Chronosphere is a cloud-native observability platform built to tame high-cardinality metrics at scale, a notorious weak spot and cost driver for Datadog. It was founded by former Uber engineers behind the M3 metrics engine.
Features
- Ingest large-scale, high-cardinality metrics from Kubernetes, microservices, and containerized environments without the performance degradation or surprise bills common with other platforms.
- Built-in Control Plane with powerful tools to control, shape, and downsample your telemetry data before it's ingested.
- Integrate with open-source standards like OpenTelemetry, Fluent Bit, and Prometheus, and allow PromQL dashboards and alerts to work without major changes.
- Query massive datasets at speed using a high-performance analytics engine capable of handling complex, multi-dimensional queries at scale.
- Expand observability coverage with newly added logs and traces, including features like Differential Diagnosis to compare trace data across time periods.
Pricing
Chronosphere pricing is usage-based and customized for each organization. Instead of per-host, it’s more likely per GB or per active series pricing. For instance, metrics might be priced per active time series or per ingested metric.
Pros and Cons
Chronosphere’s major advantage over Datadog is its cost-efficient handling of metrics at a massive scale. It’s also built for reliability at scale. It gives engineers the control to decide what data is important to store and for how long.
The trade-off is that it is a metrics-first platform. While it has tracing capabilities, its log analytics and user-monitoring features are not as comprehensive as Datadog’s all-in-one suite. Also, the cost savings narrative depends on you actively using the tools to cut down data. If you just pipe everything in blindly, you might not save much.
The Best Datadog Alternatives to Build Automated AI Workflows
Choosing a Datadog alternative isn’t just about saving money; it’s about finding the right tool for the job.
For ML and AI-centric teams, the best alternatives to Datadog are:
- ZenML is the best fit for teams that want observability embedded directly into their ML and LLM workflows. It replaces Datadog’s generic monitoring layer with pipeline-level visibility, data lineage, and model performance tracking.
- LangSmith or Arize are excellent if you need deep insight into prompts and model decisions. LangSmith is a quick SaaS solution, whereas Phoenix is an open-source LLM tracing framework.
- Chronosphere is a top pick for debugging issues in complex ML microservices. Its high-cardinality querying is second to none for pinpointing weird outliers.
If you’re interested in taking your AI agent projects to the next level, consider joining the ZenML waitlist. We’re building our first-class support for agentic frameworks (like LangGraph, CrewAI, and more) inside ZenML, and we’d love early feedback from users pushing the boundaries of what AI agents can do. With ZenML, you can seamlessly integrate whichever agent framework you choose into robust, production-grade workflows. Join our waitlist to get started.👇