On this page
Metaflow gives you a framework to build and manage machine learning workflows, but it isn’t a one-size-fits-all solution. Many teams often face problems with Metaflow’s cloud dependencies, CLI-only ops, and lack of native Windows support, which makes them explore Metaflow alternatives.
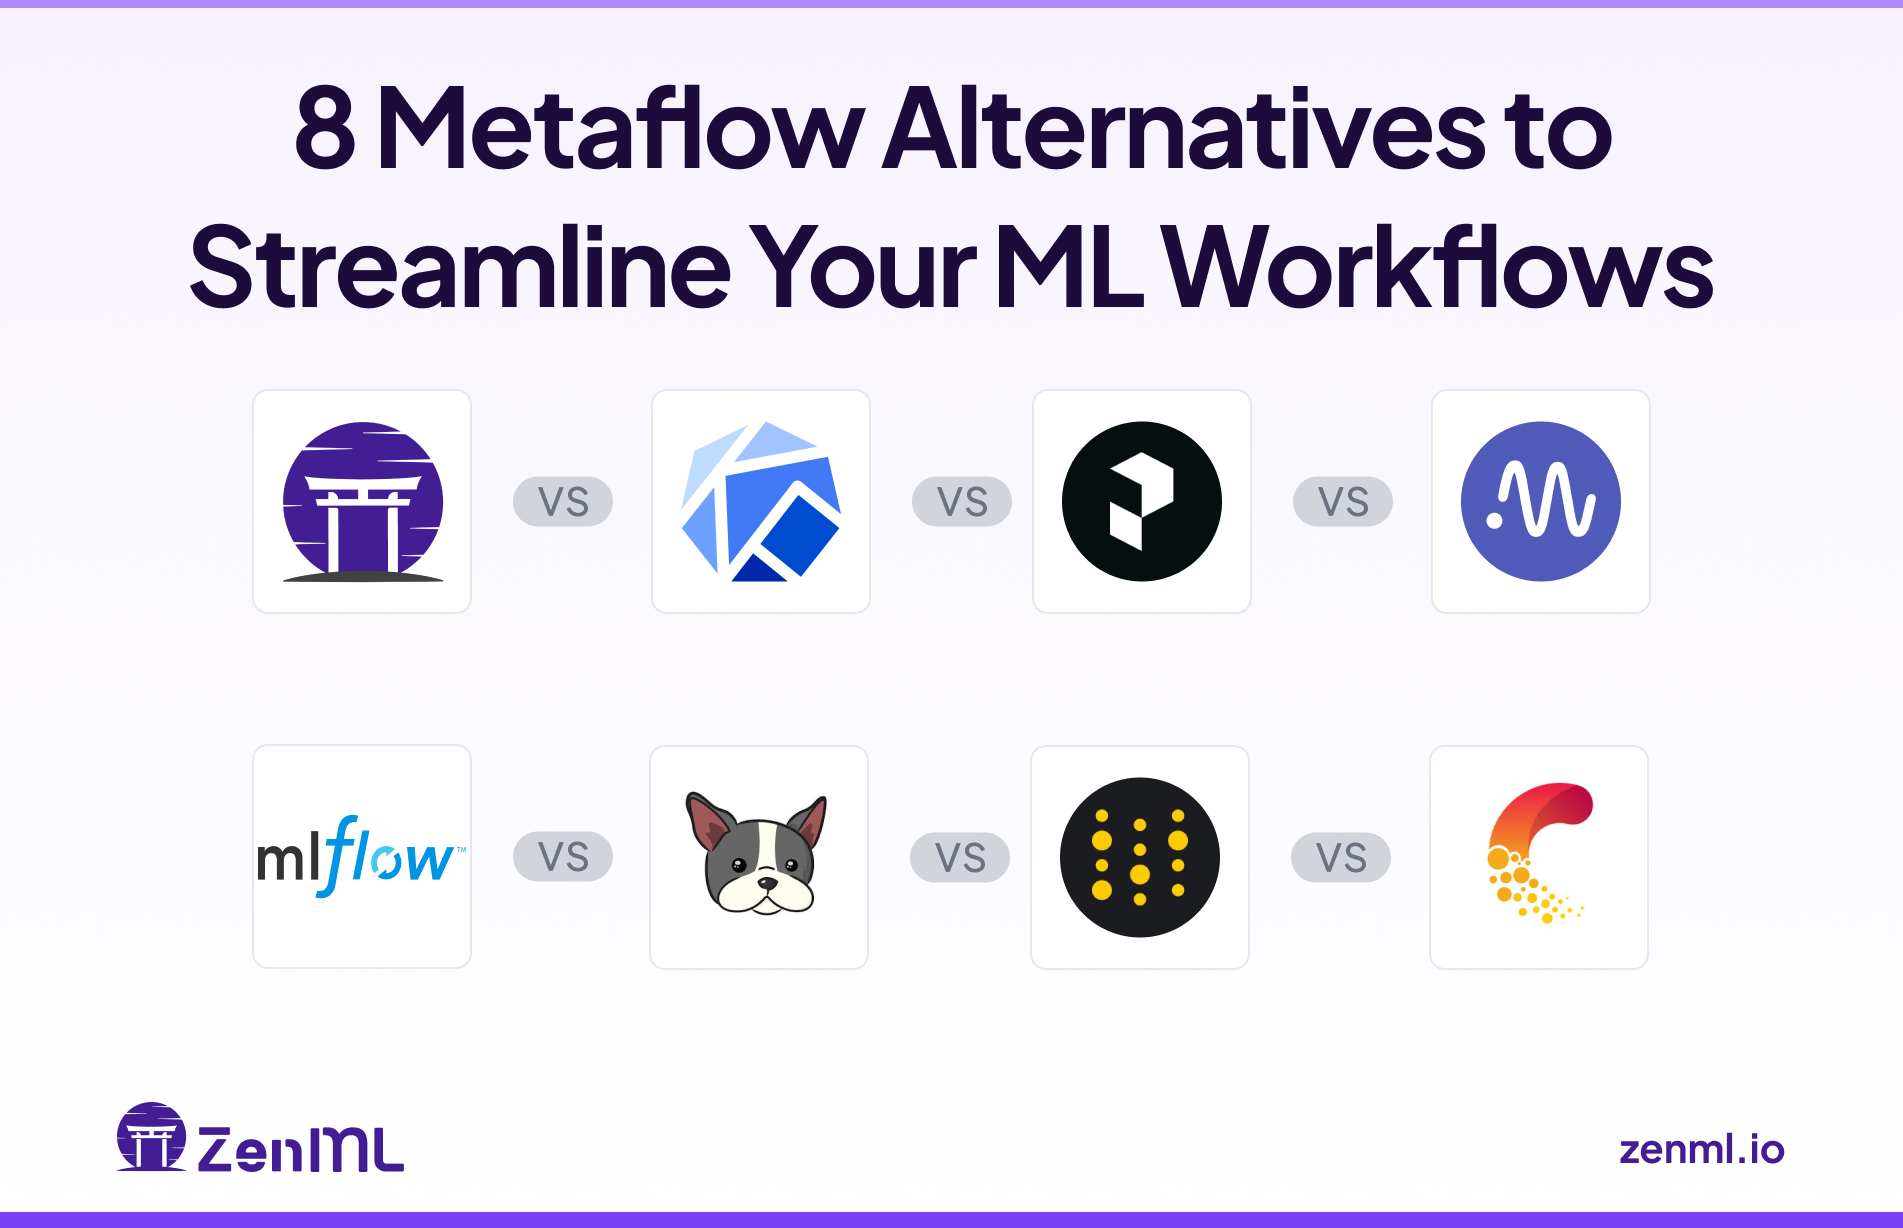
In this article, we introduce 8 alternatives that take care of the drawbacks Metaflow has and help you orchestrate pipelines, track experiments, and collaborate more effectively.
TL;DR
- Why look for alternatives: Metaflow comes with a few significant constraints – it’s tightly coupled with the AWS service, requires command-line invocation for most operations, and lacks native Windows support.
- Who might want to use these alternatives: MLOps engineers, data scientists, and technical decision-makers who need a more accessible, cloud-agnostic, or collaboration-friendly platform for ML pipelines and experiments.
- What to expect: The 8 alternatives below span different aspects of the ML workflow – from specialized pipeline orchestration frameworks like ZenML to experiment tracking platforms like MLflow. We’ve grouped these tools into 3 different categories so you can identify which best suits your team’s needs.
Recently Updated (May 2026): This guide has been refreshed to reflect three industry shifts since original publication: Anaconda’s April 2026 acquisition of Outerbounds (the company behind Metaflow), CoreWeave’s $1.7B acquisition of Weights & Biases, and the release of MLflow 3 with native GenAI agent support. All eight alternatives below reflect their current state as of May 2026.
The Need for a Metaflow Alternative
There are three core reasons why you might need to switch from Metaflow to an alternative.
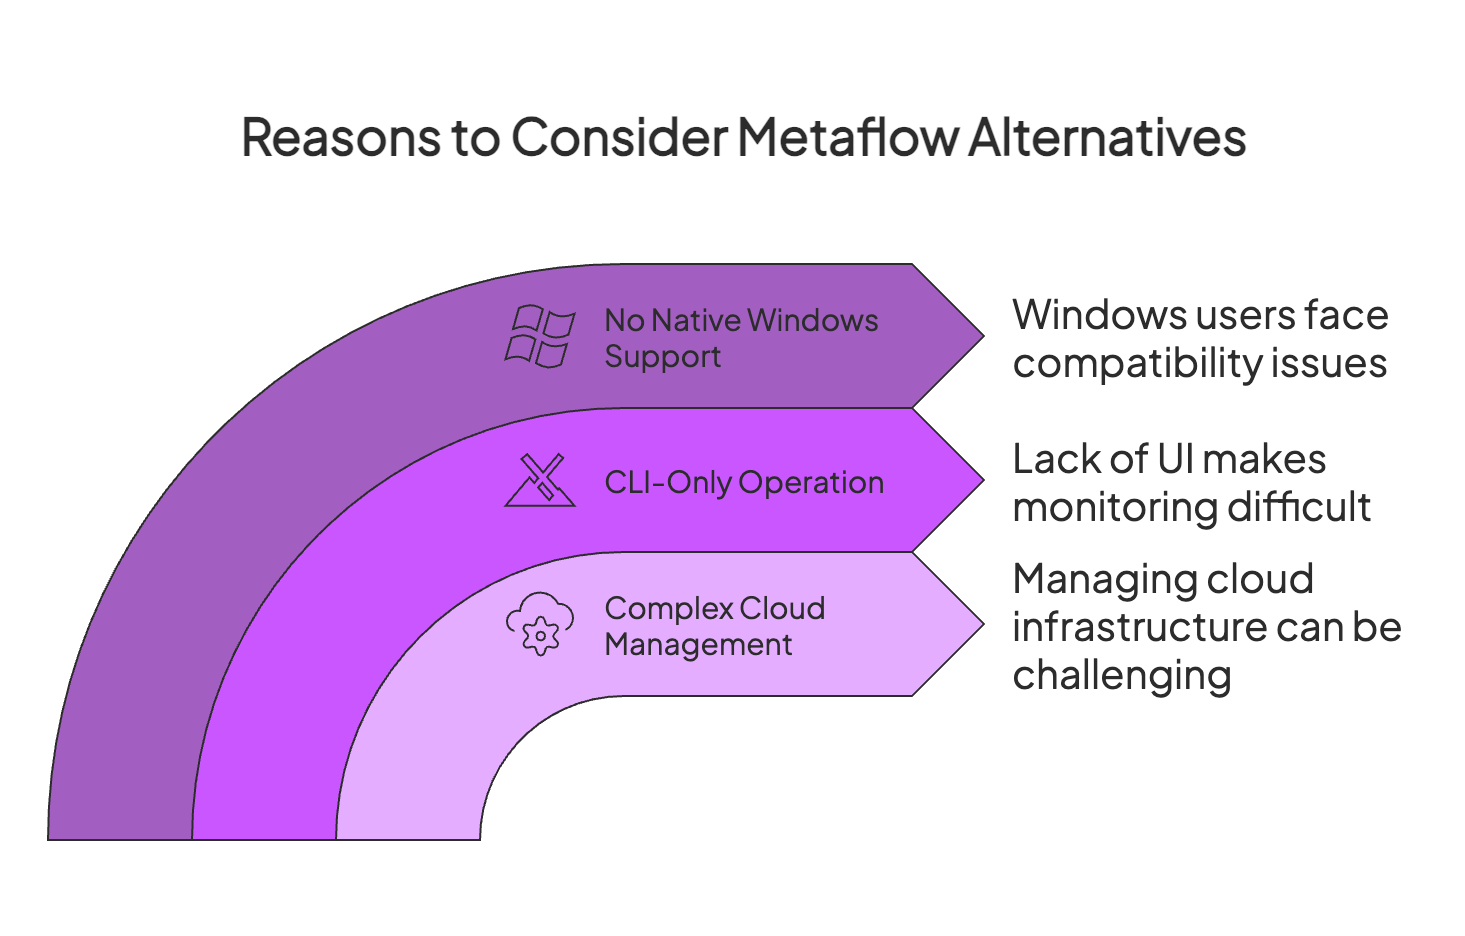
Reason 1. Complex Cloud Management and Operational Overhead
Metaflow has expanded beyond AWS-only support, now offering templates for major clouds like GCP and Azure. However, this flexibility introduces a different challenge: teams must handle significant operational overhead, including managing their own Terraform stacks, IAM configurations, and monitoring systems.
Unlike fully managed SaaS orchestrators, Metaflow requires your engineering team to take ownership of cloud infrastructure management, which can slow down iteration, increase complexity, and drive up operational costs, especially problematic for teams prioritizing rapid development cycles or minimal DevOps overhead.
Reason 2. CLI-Only Operation and Lack of UI
Metaflow’s user experience is largely code-and-CLI-driven. You write flows as Python scripts and run them via the terminal. There is no built-in web interface to monitor pipeline runs or explore results interactively. Netflix did open-source a Metaflow UI service, but it requires a separate setup and is not part of the default open-source experience.
If you haven’t set up the Metaflow UI, you must resort to command-line tools or the Metaflow client API to inspect runs and logs.
Reason 3. No Native Windows Support
If your development environment or user base includes Windows machines, Metaflow can be a problem. The platform currently doesn’t offer native support for Windows – it’s officially supported on Linux and macOS.
If you’re a Windows user, you’re forced to use workarounds like WSL (Windows Subsystem for Linux) to run Metaflow, which adds complexity and potential performance overhead.
This limitation can fragment a team’s workflow and is especially problematic if you have Windows as the standard OS for data scientists.
What the Anaconda Acquisition Means for Metaflow Users
On April 29, 2026, Anaconda announced its acquisition of Outerbounds, the company behind the open-source Metaflow framework. Anaconda is positioning the combined company as “the first unified platform spanning the entire AI-native development lifecycle,” pairing Anaconda’s package management, environments, and AI Catalyst foundation with Outerbounds’ workflow orchestration, artifact tracking, and governed deployment.
Two things were confirmed in the announcement:
- Metaflow stays open source. Anaconda explicitly committed to continued Metaflow development as an open-source project.
- Integration details aren’t finalized. Anaconda is publicly asking enterprises to sign up for updates on product timelines and integration details, a clear signal that the long-term roadmap, pricing, and combined product surface are still being worked out.
That last point is the one to flag if you’re mid-evaluation. Anaconda’s stated strategy is to fold Outerbounds into “a unified platform,” and integrations of this size often mean three things over the next 12 to 24 months:
- Pricing structure shifts. Outerbounds today is a predictable flat-fee MLOps platform. Anaconda’s commercial model is a broader bundled platform spanning package governance, model catalog, and now orchestration. Standalone tiers like the $1,199 to $2,499/mo Starter rarely survive integrations of this kind without being repackaged, repriced, or rolled into a wider “Platform” contract at renewal. That renewal is typically at a higher number, since you’re now paying for the whole stack instead of just orchestration.
- Migration paths appear. Even if the current Outerbounds product keeps running, you might be steered toward the unified platform within a year or two. That’s a re-architecture, not a config change. It will take a lot of resources.
- Roadmap priorities reset. Whatever was on the Outerbounds roadmap last quarter now competes with everything Anaconda needs to ship to make the integration story land. Features specific to standalone Outerbounds workflows might drop a notch in priority.
It’s just how integrations of this size typically play out. But if you’re already evaluating Metaflow alternatives, the Anaconda news is a reason to make that decision sooner rather than later. The product you choose today should be one whose roadmap isn’t being re-drawn around someone else’s strategy.
If you’d rather bet on a roadmap that isn’t in flux, ZenML offers the same cloud-agnostic, bring-your-own-infrastructure model with no lock-in to a post-acquisition transition. The eight alternatives below cover the rest of the landscape so you can compare in context.
Evaluation Criteria
When evaluating Metaflow alternatives, we considered several key criteria to ensure the alternatives meet the demands of production ML workflows. Below are three of the most important aspects we looked for.
1. Workflow Orchestration Capabilities
A strong alternative must provide robust pipeline orchestration features beyond what Metaflow offers.
We examined how each tool handles the creation and execution of multi-step workflows: Can you define complex DAGs (Directed Acyclic Graphs) of tasks with dependencies, loops, or conditional logic? Is there support for scheduling recurring jobs or triggering runs based on events?
We also looked at scalability – for instance, running steps in parallel or on distributed infrastructure (like Kubernetes clusters or cloud VMs) to speed up big jobs.
Good orchestration also means reliability features like retry policies, failure notifications, caching of intermediate results, and easy debugging of failures.
Essentially, the alternative should make it easy to go from a simple prototype to a production-grade pipeline, handling automation and scale without a lot of manual plumbing.
2. Experiment Tracking and Governance
Machine learning workflows are iterative, so experiment tracking is crucial. We evaluated whether each alternative can automatically log or easily record parameters, metrics, artifacts, and lineage for each run, and present this information in a usable way.
Beyond tracking, we also looked for governance features like:
- Support for multi-user environments
- Role-based access control
- Audit logs
Tools that offer model registries or reproducibility safeguards (like environment snapshotting, pip requirements logging) scored high on governance.
3. Integration and Flexibility
Finally, we assessed each tool’s integration and flexibility within broader ML and DevOps ecosystems. This includes the ability to work with your existing tech stack and adapt to different workflows. Does the platform lock you into a specific ecosystem, or is it vendor-neutral and framework-agnostic?
We favored alternatives that support multiple programming languages or ML frameworks like TensorFlow, PyTorch, scikit-learn, etc., and that can run on various environments (on-prem servers, major cloud providers, or hybrid setups).
👀 Note: All the above-mentioned drawbacks are taken care of if you invest in Outerbounds – a platform that offers managed Metaflow plans. But apart from Outerbounds, there are several other alternatives that might serve you better.
What are the Best Alternatives to Metaflow?
Some of the best Metaflow competitors and alternatives are:
| Category | Alternatives | Key Features |
|---|---|---|
| 1. Workflow Orchestration and Deployment | ZenML, Kubeflow, Prefect | •Build scalable, production-grade ML pipelines •Supports multi-cloud and hybrid deployments |
| 2. Experiment Tracking | Neptune, MLflow, DagsHub | •Log and compare parameters, metrics, and artifacts •Integrated or built-in model registry support |
| 3. Visualization and Collaboration | Comet, Weights & Biases | •Real-time training dashboards and metrics visualization •Team collaboration with shared projects and reports |
For a more detailed side-by-side view, here is how each tool compares across the criteria above:
| Tool | Category | Best For | Native Windows | Pipelines + Tracking | 2025-2026 Notable Change |
|---|---|---|---|---|---|
| ZenML | Orchestration + Tracking | Teams wanting one tool for classical ML and agent workflows across any cloud | Yes | Yes | 50+ integrations, agent-aware steps |
| Kubeflow | Orchestration | Kubernetes-native enterprises with a platform team | No (needs K8s) | Partial (via add-ons) | 1.10+ improved IAM and multi-tenancy |
| Prefect | Orchestration | Python-first teams wanting hybrid SaaS or self-host | Yes | No (orchestration only) | Prefect 3 reduces pipeline-to-prod friction |
| MLflow | Experiment Tracking | Open-source tracking, now also agent observability | Yes | Tracking only | MLflow 3 adds ResponsesAgent and GenAI scorers |
| Neptune | Experiment Tracking | Lightweight tracking with strong comparison views | Yes | Tracking only | Continued framework callback expansion |
| DagsHub | Tracking + Versioning | Git-style versioning for code, data, and models | Yes | Tracking only | Tighter MLflow + DVC integration |
| Comet | Visualization | Real-time dashboards with rich plotting | Yes | Tracking only | Steady release cadence |
| Weights & Biases | Visualization | Hosted collaboration, now on CoreWeave's GPU stack | Yes | Tracking only | Acquired by CoreWeave May 2025 ($1.7B) |
Category 1. For Workflow Orchestrations and Deployment
The first three alternatives – ZenML, Kubeflow, and Prefect are geared towards orchestrating ML workflows and handling deployments of models or pipeline workloads.
1. ZenML
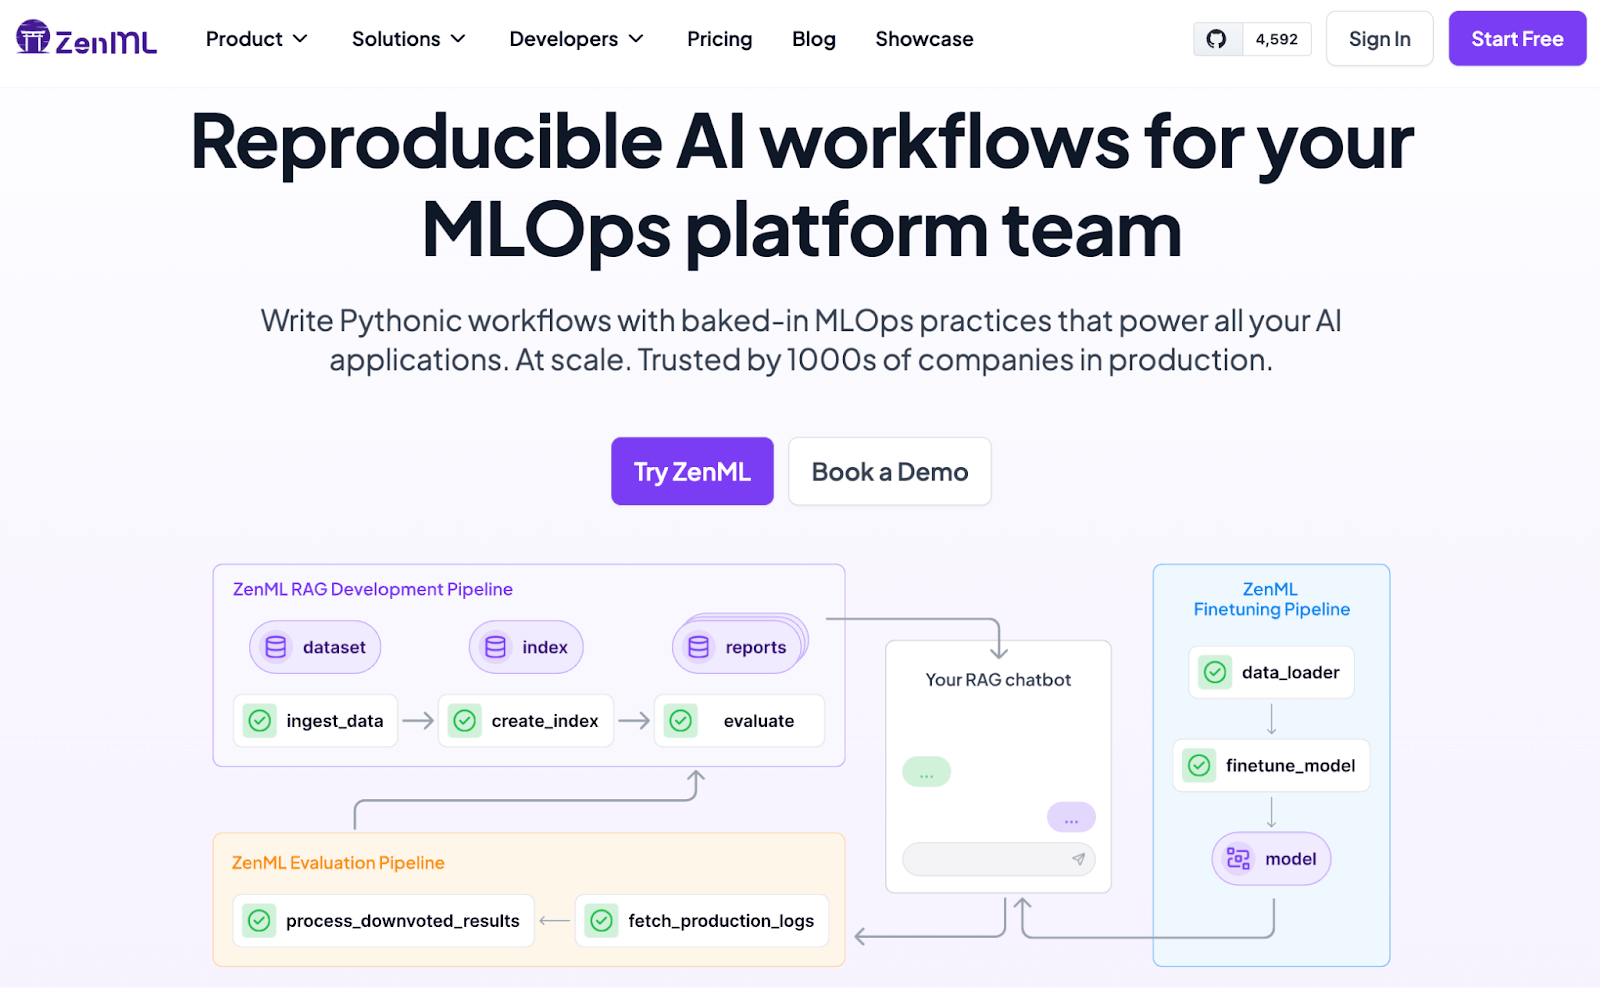
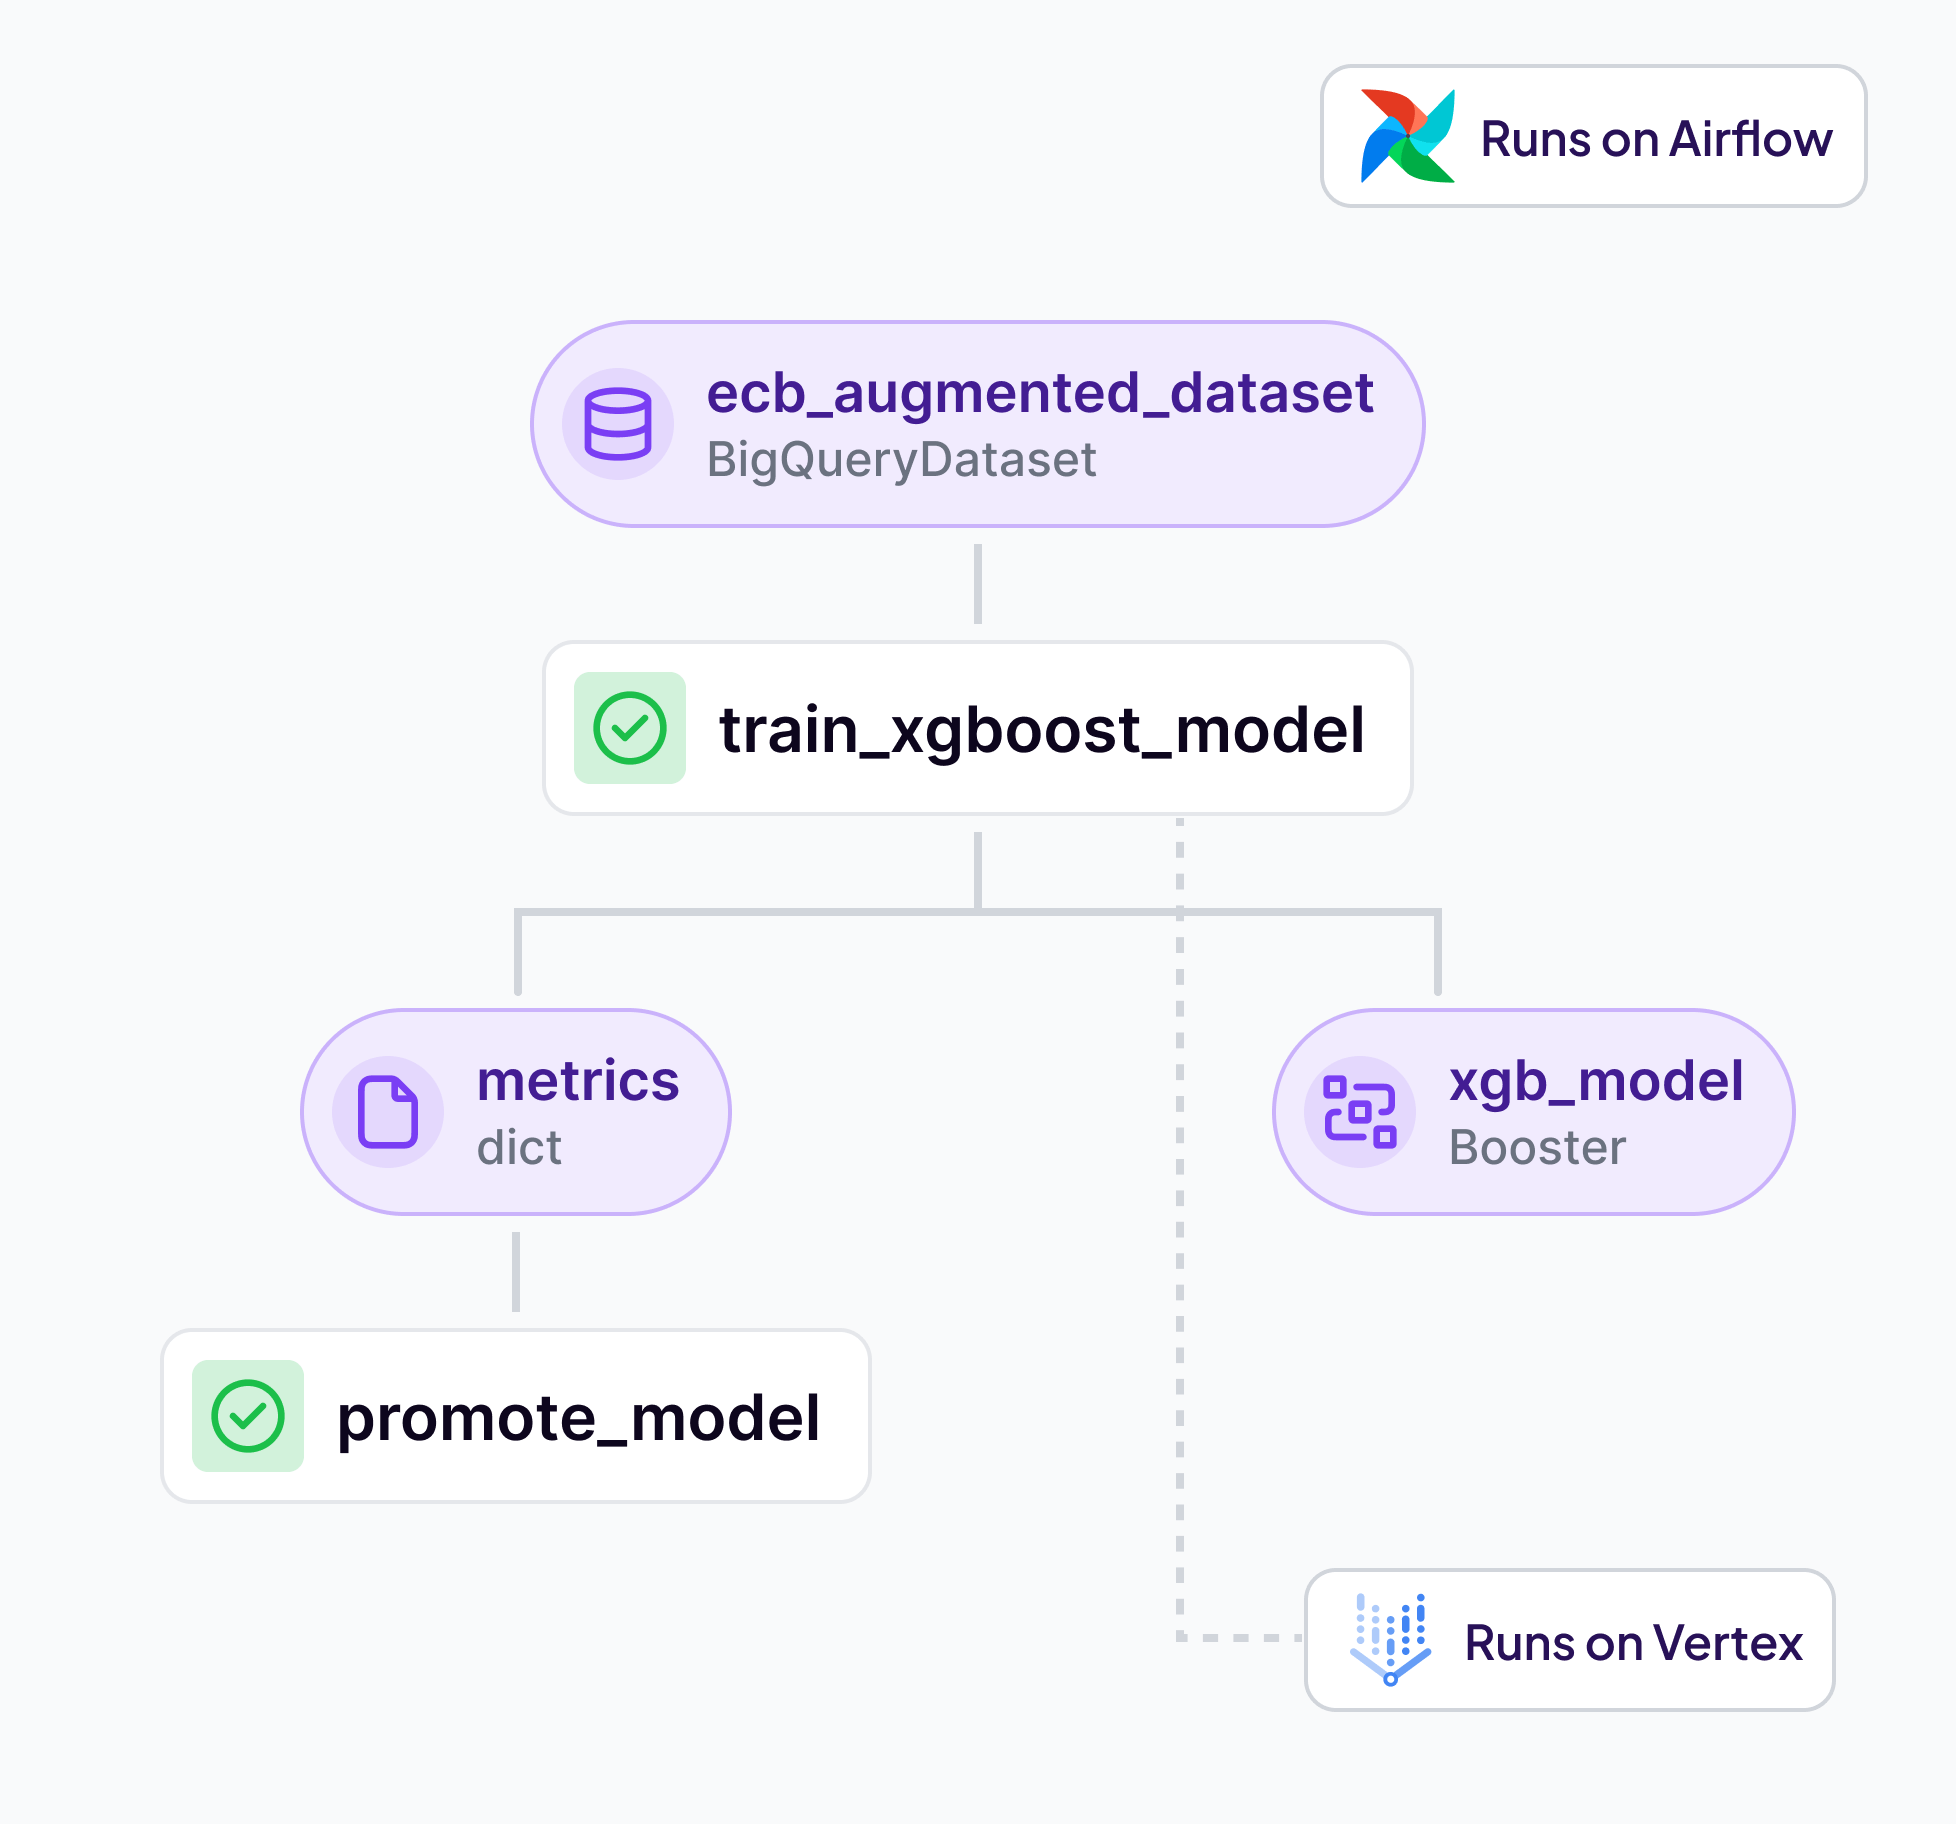
ZenML is an open-source MLOps framework that focuses on pipeline-centric workflow orchestration. It lets you write standard Python code and turn it into reproducible ML pipelines with minimal effort.
ZenML emphasizes flexibility – it works with multiple orchestrators (like Airflow, Kubeflow, and more) and cloud providers out of the box.
ZenML Workflow Orchestration and Deployment Features
With ZenML, you define your pipeline steps as Python functions using simple decorators – @step and @pipeline. The framework then orchestrates these steps on your chosen backend, whether that’s running locally for quick iteration or on a cloud orchestrator like Kubernetes.
You can create a step on ZenML with a few lines of code:
from zenml import step

@step
def load_data() -> dict:
    training_data = [[1, 2], [3, 4], [5, 6]]
    labels = [0, 1, 0]
    return {'features': training_data, 'labels': labels}
ZenML also facilitates deployment of models: for example, it integrates with model serving tools and can deploy models as part of the pipeline, bridging the gap between training and production.
Overall, ZenML’s orchestration features aim to give you production-ready pipelines from day one – it manages scheduling, caching of steps, artifact storage, and even CI/CD-like deployment of pipeline infrastructure.
Other Prominent Features
- Rapid iteration with caching: Accelerates your workflow with smart caching, so repeated pipeline runs skip unchanged steps.
- Multi-cloud scalability: Offers limitless scaling by letting you deploy pipelines across clouds or on-prem with unified resource management. You can switch orchestrators without rewriting your pipeline code, ensuring backend flexibility with zero lock-in.
- Automatic experiment logging: Auto-tracks everything, automatically logging parameters, metrics, artifacts, and source code for each pipeline run.
- Reusable pipeline components: Promotes collaboration through shared ML building blocks – lets you create standardized steps or pipelines and reuse them across projects.
Pros and Cons
ZenML gives you an end-to-end MLOps solution – orchestration + tracking + deployment that’s open source and extensible. It has a pluggable architecture with 50+ integrations. These integrations let you use your preferred orchestrators, model servers, and experiment trackers without vendor lock-in.
However, our platform does not have a native Spark/Ray runner; you must wire these frameworks yourself.
2. Kubeflow
Kubeflow is an open-source toolkit for running machine learning workloads on Kubernetes. It’s often dubbed “the machine learning toolkit for Kubernetes” because it allows you to define and execute ML pipelines at scale on cloud or on-prem Kubernetes clusters.
Kubeflow Workflow Orchestration and Deployment Features
At the heart of Kubeflow is Kubeflow Pipelines, a robust platform for building and deploying portable ML workflows using containers.
You author pipelines in Python using the Kubeflow Pipelines SDK – essentially writing Python functions and decorating them to define pipeline steps, which Kubeflow then containerizes and orchestrates on Kubernetes.
export PIPELINE_VERSION=2.4.0
kubectl apply -k "github.com/kubeflow/pipelines/manifests/kustomize/cluster-scoped-resources?ref=$PIPELINE_VERSION"
kubectl wait --for condition=established --timeout=60s crd/applications.app.k8s.io
kubectl apply -k "github.com/kubeflow/pipelines/manifests/kustomize/env/dev?ref=$PIPELINE_VERSION"
In terms of deployment, Kubeflow integrates with Kubernetes, meaning it can scale out training or inference jobs easily. It includes custom Kubernetes controllers for popular frameworks: for instance, Kubeflow’s TFJob and PyTorchJob operators will manage distributed TensorFlow or PyTorch training jobs on the cluster.
Other Prominent Features
- Includes built-in support for distributed training of machine learning models. Using its custom controllers (TFJob, PyTorchJob, MXNetJob, etc.), you can run large-scale training on Kubernetes – the platform handles launching worker pods, coordinating training, and managing cluster resources for you.
- Has an integrated hyperparameter optimization service called Katib. You can define a hyperparameter search – Bayesian optimization, grid search, random search, etc., and Katib will launch multiple training trials in parallel on Kubernetes and automatically find optimal parameters.
- Helps you deploy Jupyter Notebooks on the cluster, making it easier for data scientists to utilize cluster resources from a familiar interface.
Pros and Cons
There’s no doubt that Kubeflow is extremely powerful and flexible for those who need to run anything from simple to complex pipelines on a Kubernetes cluster. The platform has a rich ecosystem of components. Beyond pipelines, you get notebooks, experiment tracking, distributed training operators, and more.
However, Kubeflow is notoriously complex to deploy and maintain. It often demands significant DevOps efforts and Kubernetes expertise; things can and do break during upgrades or if underlying cluster resources are misconfigured.
📚 Learn more: Kubeflow documentation.
3. Prefect
Prefect is a general-purpose workflow orchestration tool that takes a simple yet modern approach to managing data pipelines. It isn’t exclusive to ML – you can orchestrate any Python workflows – but it’s quite relevant to ML tasks as well.
Prefect Workflow Orchestration and Deployment Features
Prefect turns your Python functions into units of work (tasks) and your scripts into flows. You decorate Python functions with @task and combine them in a @flow to create a directed workflow. The platform handles scheduling, execution, and retry logic for these tasks, so you don’t have to write your own cron jobs or error handling loops.
from prefect import flow

@flow
def my_flow():
    print("Hello, Prefect!")

if __name__ == "__main__":
    my_flow.deploy(
        name="my-second-deployment",
        work_pool_name="my-work-pool",
        image="my-image",
        push=False,
        cron="* * * * *",
    )
One of Prefect’s standout features is its hybrid execution model: you can run the Prefect Orion API server, which can be self-hosted or use Prefect Cloud, that acts as a control plane, and then deploy lightweight agents in whatever environment you want to execute the tasks (your local machine, a Kubernetes cluster, ECS, etc.).
Prefect 3.0 redefines workflow deployment with a focus on flexibility, resilience, and scalability. The introduction of work pools replaces traditional agents, enabling dynamic infrastructure provisioning across environments like Docker, Kubernetes, and serverless platforms like AWS ECS and Google Cloud Run.
Prefect 3.0 also introduces deployment versioning, which allows teams to track changes and revert to previous configurations if needed.
Other Prominent Features
- Lets you attach schedules to flows easily. This makes it simple to automate recurring training jobs. Prefect also has built-in retry logic and failure notifications. If a task fails, it can automatically retry based on rules you set.
- The agent system lets you execute tasks in multiple execution environments. There are off-the-shelf agents for Kubernetes, Docker, local processors, etc.
- The platform takes care of passing data between tasks if needed (does so using a result backend). Prefect can serialize Python objects and store them so that tasks don’t have to recompute everything from scratch.
Pros and Cons
Prefect is developer-friendly and highly Pythonic, which means data scientists and ML engineers can pick it up quickly without needing DevOps help for basic pipelines. Prefect Cloud (hosted option) provides a low-effort way to get a production-grade orchestrator with minimal setup – they host the control plane, and you just run an agent.
Unfortunately, Prefect doesn’t have built-in experiment tracking and model management. You must integrate Prefect with MLflow, W&B, or other platforms to get such functionalities.
📚 Learn mode: Prefect documentation.
Category 2. For Experiment Tracking
Neptune, MLflow, and DagsHub specialize in experiment tracking. If Metaflow’s experiment logging or lineage features feel lacking, these tools can fill the gap.
4. Neptune
Neptune is a lightweight yet powerful experiment tracking tool designed to help individuals and teams keep track of countless ML experiments in a structured way.
Neptune Experiment Tracking Features
Nepture provides an experiment dashboard where each run of your model (an experiment) is logged and can be viewed later. To use Neptune, you initialize a run in your code – neptune.init_run(project="workspace/project"), and then log various things:
- Scalars like metrics, for example, accuracy per epoch
- Hyperparameters
- Text logs
- Images like confusion matrix plots
- Artifacts – model weights, data files
Neptune’s client libraries integrate with many popular ML frameworks to enable convenient logging. For example, it has built-in callbacks for Keras, PyTorch Lightning, XGBoost, etc., so you can auto-log metrics without a ton of custom code.
One powerful feature is the ability to compare multiple experiments side by side: select a few runs and Neptune will display their metrics plots overlaid, or a table of final results for easy comparison.
Other Prominent Features
- The platform can track structured metadata like model hyperparameters, evaluation scores, hardware details, and more. You can then use the UI to create custom charts that help you visualize training progress or compare experiment outcomes in detail.
- As your experiments are running, you can watch the metrics update in real-time on the dashboard. This training monitoring feature helps you catch issues as soon as they occur – for example, if a metric is NaN or performance is deteriorating, you will see it live.
Pros and Cons
With Neptune, you aren’t forced into a fixed schema for your metadata. You will appreciate this flexibility when experiments have lots of custom information. The platforms also make collaboration easier, as you can invite your colleagues to a Neptune project to see all the runs.
One thing we noticed Neptune lacks – Unlike Metaflow, which implicitly captures code versions and artifacts in some cases, Neptune requires you to instrument your code (even if just adding a few lines). If someone forgets to log something, it won’t be captured. There is some automation (like auto-logging callbacks), but generally it’s an explicit step to use Neptune, which could be skipped if not enforced.
📚 Learn more: Neptune documentation.
5. MLflow
MLflow is one of the most popular open-source platforms for managing ML experiments and model lifecycles. Originally developed by Databricks, MLflow has four key components – tracking, model registry, projects, and models – but it’s best known for its experiment tracking capabilities.
MLflow Experiment Tracking Feature
The MLflow Tracking component is what you will be using the most. You run your training code and use MLflow’s APIs to log information.
For example, mlflow.log_param("optimizer", "adam") or mlflow.log_metric("accuracy", 0.93).
MLflow automatically keeps track of these logs under an ‘experiment’ name or ID. By default, it stores data in a local file system or an SQL database and can save artifacts (like model binaries) to a file store or cloud storage.
You can launch the MLflow UI mlflow ui and it will let you view a list of runs that you can further filter by parameters, and see metrics charts.
Other Prominent Features
- MLflow is completely open-source and works with any ML library. It doesn’t impose how you run your code – you add MLflow logging calls inside your code or use built-in integrations.
- MLflow Projects is a feature to package ML code with its environment (using a conda YAML or Docker) so that anyone can run that code with
mlflow run. - MLflow Models can be deployed using MLflow’s built-in serving mechanisms. For example,
mlflow models servespins up a local REST API serving a logged model.
Pros and Cons
MLflow, being open-source with an API and CLI, lets you extend the platform or integrate into custom platforms. The tool also has a model registry built in. This adds a production-oriented layer. This means that you can manage the promotion of models to production with approvals, comments, etc., which is useful in an organizational setting.
Although it’s an excellent experiment tracking platform, MLflow on its own doesn’t schedule or run experiments; it assumes you are running them and just calling MLflow to log. For users expecting a one-stop platform, MLflow might seem incomplete. You must pair it with other tools for a full MLOps workflow.
📚 Learn more: MLflow documentation.
6. DagsHub
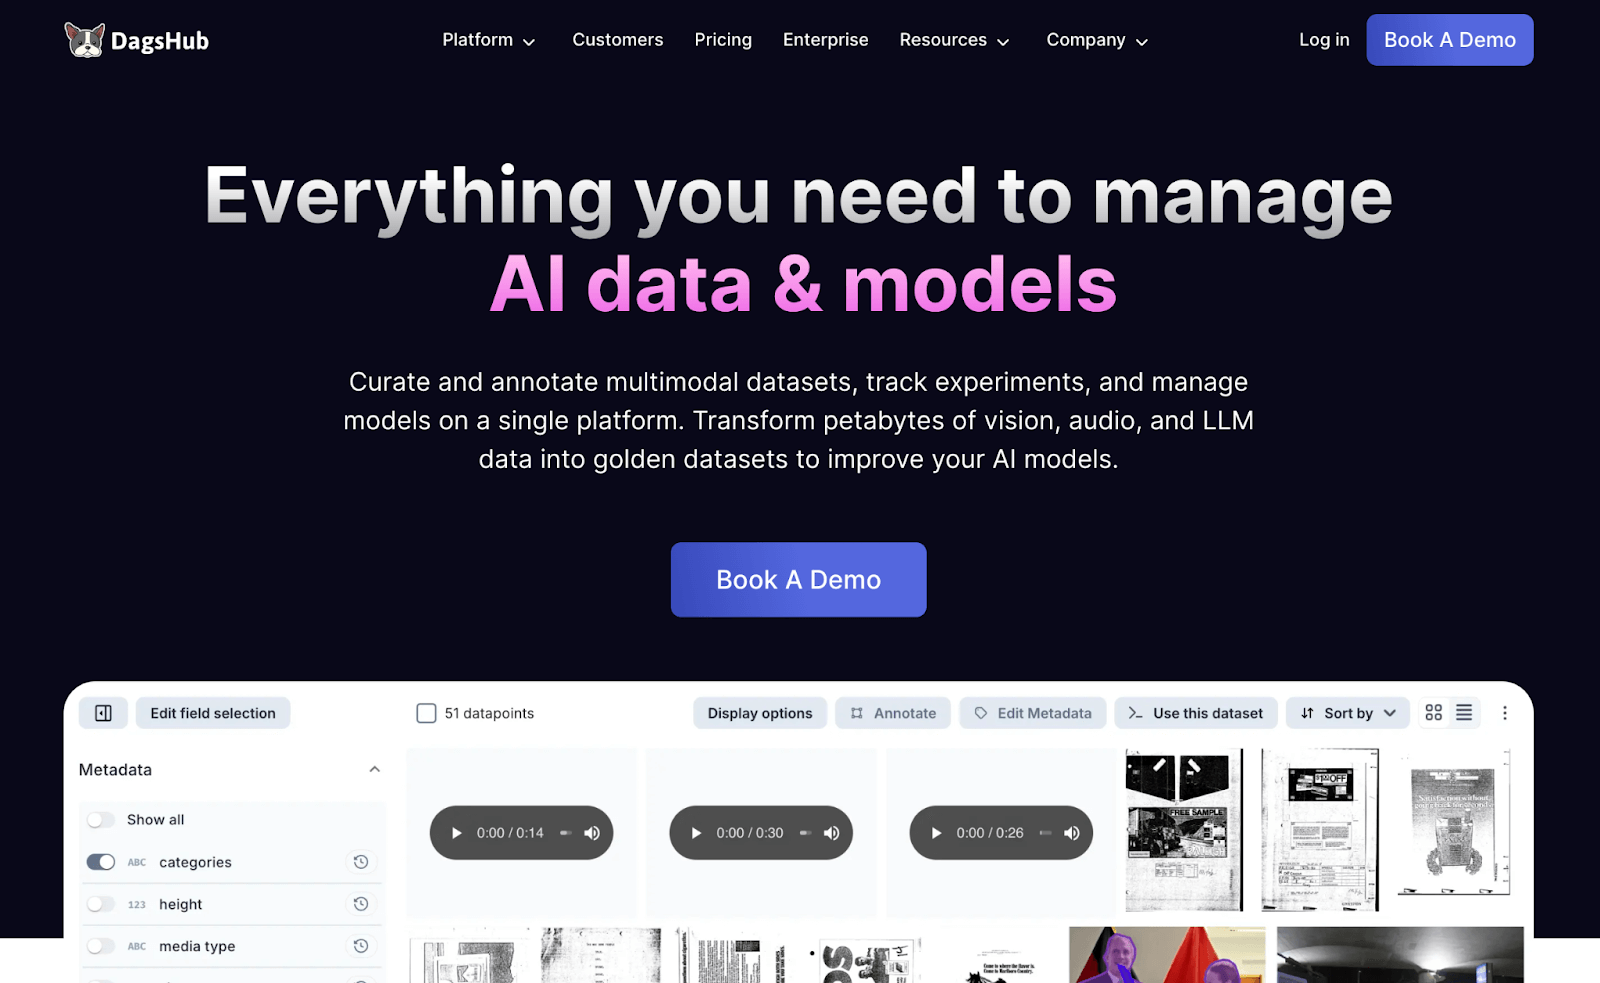
DagsHub is a web-based collaboration tool that integrates version control for code, data, and experiments. Essentially, DagsHub combines several open-source tools under one roof to provide a central place for ML projects.
DagsHub Experiment Tracking Feature
DagsHub’s experiment tracking is powered by MLflow. When you push experiment logs to DagsHub, you’re essentially logging to an MLflow Tracking Server hosted by DagsHub for your project.
This means you get compatibility with all MLflow logging methods. For example, you run your training script with MLFLOW_TRACKING_URI set to DagsHub’s tracking URI, and then all mlflow.log_metric calls will send data to DagsHub.
Because it’s built on MLflow, DagsHub’s experiment tracking inherits features like parameters, metrics, artifacts, etc.
Other Prominent Features
- Integrates DVC (Data Version Control) so you can version large datasets and models. In the UI, you can see tracked data files, their versions, and even get visual diffs for certain data types.
- Offers a built-in labeling/annotation interface (through its ‘Curate & Annotate’ product). This lets you have data labeling tasks managed within DagsHub and the labels versioned.
- There’s a ‘Models’ section (Manage Models) in DagsHub that acts as a model registry. It allows you to register models, usually reference model files tracked by DVC or MLflow, and perhaps track their lineage.
Pros and Cons
DagsHub brings together version control, data management, and experiment tracking in one place. Everything in a DagsHub project can be made visible to collaborators or the public if it’s open-source.
One major disadvantage of DagsHub, though, is that using DagsHub means relying on a third-party platform unless you only use their open-source components separately.
📚 Learn more: DagsHub documentation.
Category 3. For Visualization and Collaboration
Comet and Weights & Biases are the two Metaflow alternatives that excel in experiment visualization and team collaboration.
7. Comet
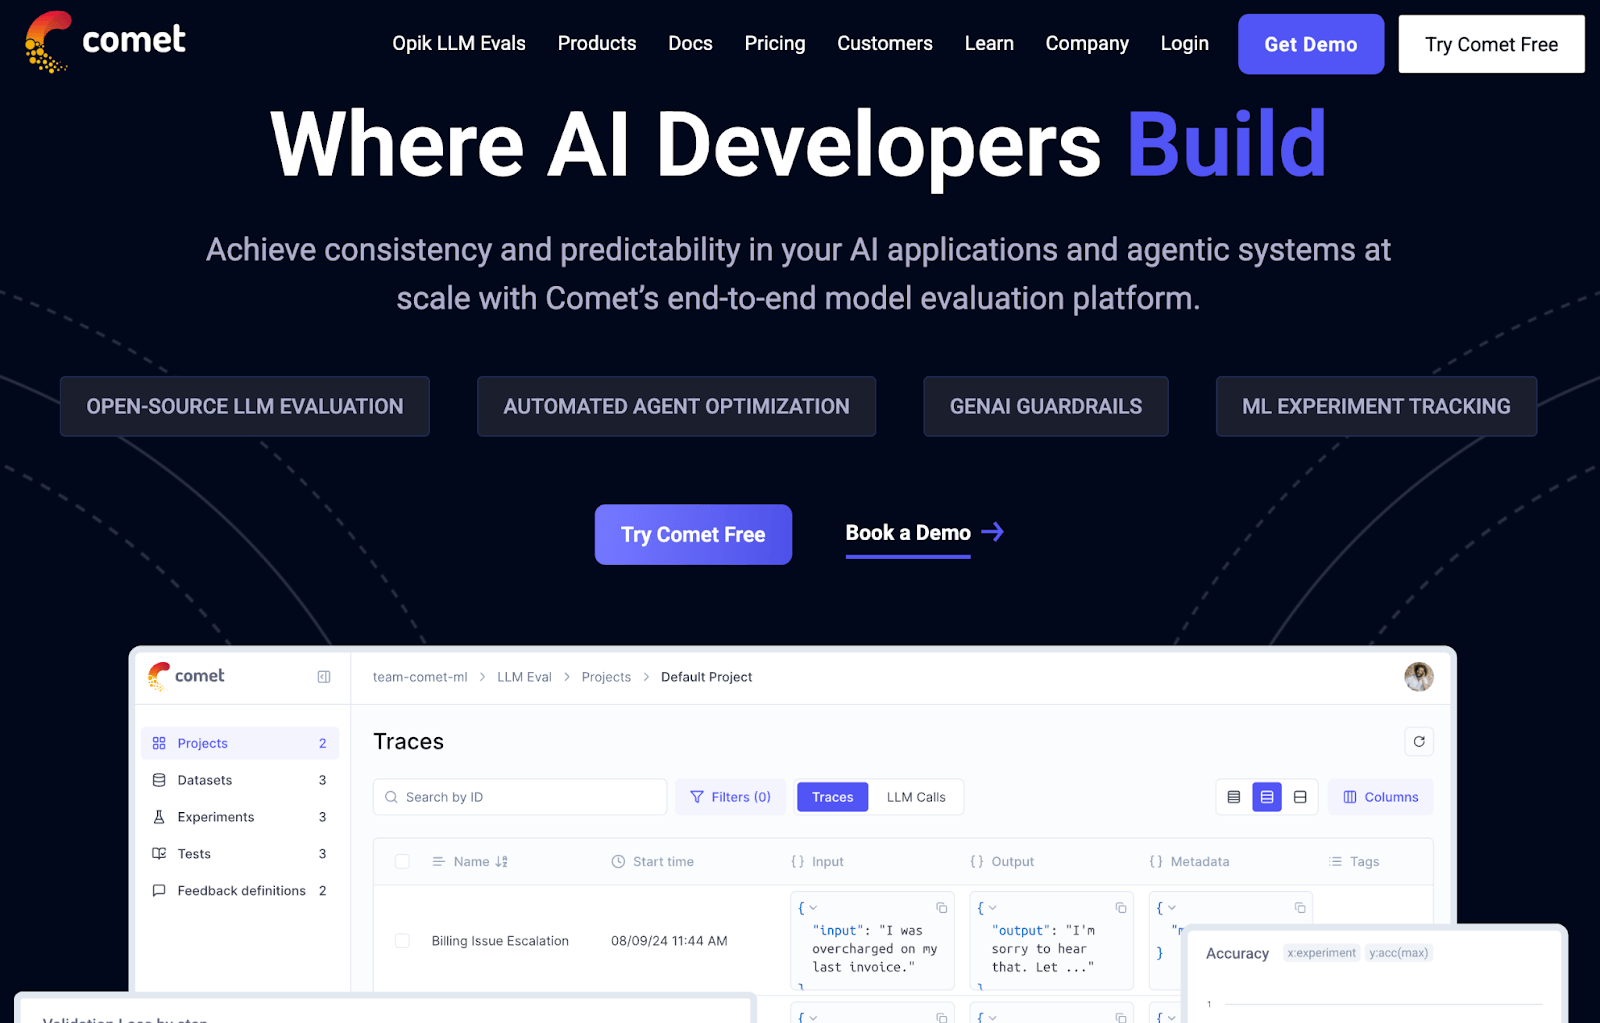
Comet is an ML experimentation and model management platform known for its rich visualization capabilities and broad feature set. As a SaaS (with on-prem available) offering, Comet allows you to track experiments, visualize metrics in real time, compare results, and collaborate with team members.
Comet Visualization and Collaboration Features
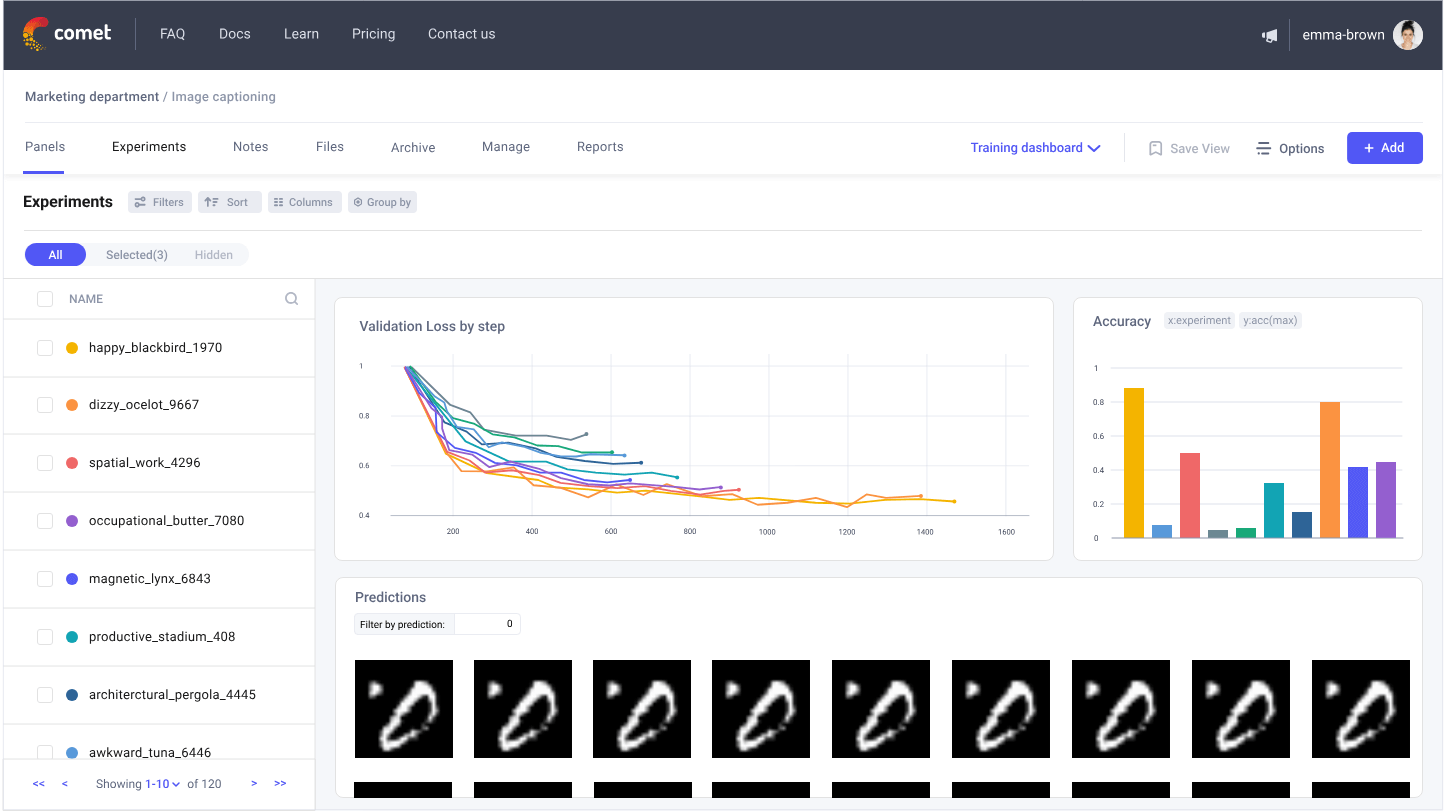
Comet’s experiment tracking goes beyond logging metrics – it’s about making sense of those metrics through visualization. When you log experiments to Comet, you automatically get a dashboard that shows all runs with key metrics and metadata.
One of Comet’s hallmark features is its interactive visualizations: you can view detailed charts of your metrics (loss curves, accuracy over time, etc.), and overlay multiple runs on the same chart to compare performance. The UI is highly configurable; it lets you create a panel that shows a scatter plot of two metrics for all experiments to identify a sweet spot.
Another key aspect is real-time monitoring. As your model trains, Comet streams metrics and even model outputs to the dashboard. You can literally watch training progress, seeing if a model is converging or if it’s starting to overfit.
Comet’s workspaces and user management further enhance collaboration: teams can work in a shared workspace where everyone’s experiments are visible. You can organize experiments with tags, projects, or groups.
Other Prominent Features
- Integrates with Jupyter, Git, and various CI/CD tools. It can automatically log Git commit hashes, environment packages, etc., to ensure reproducibility.
- Includes a Model Registry where you can register the best models, version them, and record metadata like evaluation metrics or deployment status.
- Provides an Artifacts system for dataset and model versioning. The feature lets you log datasets or data processing outputs as artifacts, and Comet will keep track of them with versions and lineage, which experiment produced which artifact and which models were produced from which data.
Pros and Cons
Comet covers a lot of bases – you get experiment tracking, visualization, model registry, and monitoring in one. The ability to visualize and compare experiments in so many ways greatly aids in understanding model behavior and making better decisions.
However, like others in this category, Comet doesn’t run your code for you. You’ll still need something like Metaflow, Airflow, or a custom script to execute training jobs and call Comet’s API.
📚 Learn more: Comet documentation.
8. Weights & Biases
Weights & Biases offers experiment tracking with real-time logging, similar to Comet, and places a big emphasis on team collaboration and reporting. It’s a hosted solution (with on-prem available) that integrates effortlessly with many ML frameworks via a few lines of code.
Weights & Biases Visualization and Collaboration Features
W&B provides a web dashboard where all experiments, called ‘runs,’ are recorded within projects. Once you instrument your code with wandb.init() and log metrics or use W&B’s callbacks, you can watch your model’s training progress live on the dashboard.
The platform’s visualization capabilities are rich: every metric you log gets its own interactive plot. If you log images, W&B will display them; if you log bounding boxes or segmentation masks in computer vision, W&B has special image panels to show those.
Collaboration is deeply woven into W&B. You can annotate all runs with notes, tag them, or even compare in groups. Team members can view each other’s experiments in real time.
W&B supports organizations and teams: within an org, you can have multiple projects and control who can view/edit them. Everything is hosted, so sharing results is as simple as sending a URL.
W&B’s reports are like interactive notebooks that live on the platform. In a Report, you can write narrative text, including plots from any experiment, tables comparing experiments, and even LaTeX/math.
Lastly, W&B also has features for permissions and privacy: in W&B, you can set projects to private, invite specific collaborators, or open them up.
Other Prominent Features
- Comes with a built-in Sweeps feature, which allows you to define a hyperparameter search (grid, random, Bayesian), and W&B will orchestrate the trials.
- You can create custom dashboards in W&B where you pin certain metrics or plots for continuous monitoring.
- W&B Artifacts is a system for versioning data and models. You can log data sets or models as artifacts, and W&B will hash them and keep track of versions and their usage.
Pros and Cons
W&B requires just a few lines to integrate into training code, and immediately, you get a rich dashboard. Its interface is generally intuitive with a polished feel, making it easy for teams to adopt and stick with it. The Reports feature and team dashboards turn experiment tracking into a collaborative exercise rather than just a logging duty.
However, the free tier of W&B is good for personal projects and research, but teams will likely need a paid plan, especially for private projects with many runs or large data logging.
📚 Learn more: WandB documentation.
Common Questions About Metaflow Alternatives
Is Metaflow still being actively developed in 2026?
Yes. Metaflow 2.18 added recursive steps and conditional step transitions for agentic workflows, and Anaconda acquired Outerbounds (Metaflow’s commercial sponsor) in April 2026. Active development is not a reason to migrate away on its own, but the AWS coupling, CLI-only workflow, and lack of native Windows support are still the same trade-offs called out earlier in this guide.
Which Metaflow alternative supports Windows natively?
ZenML and Prefect both run natively on Windows without WSL. Kubeflow does not, since it requires a Kubernetes cluster. The tracking-only tools (MLflow, Neptune, Comet, W&B) have native Windows clients but cover only part of the workflow.
What is the closest Metaflow alternative for AWS-heavy teams?
ZenML and Kubeflow are the closest functional equivalents for AWS-centric MLOps. ZenML offers AWS integration without the AWS lock-in, so you can change orchestrators or clouds without rewriting pipelines. Kubeflow on EKS gives you a Kubernetes-native equivalent if your team has the ops capacity to run it.
Which Metaflow alternative is best for agentic or GenAI workflows?
ZenML and MLflow 3 have the most direct agent-workflow story today. MLflow 3 added the ResponsesAgent class and session-level scorers for evaluating conversational agents. ZenML’s pipeline-centric model treats agent loops as composable steps with full lineage, which suits teams running both classical ML and agent workloads on one platform.
Should I switch from Metaflow now that Anaconda owns Outerbounds?
The acquisition itself is not a reason to switch. The reasons to evaluate alternatives are the same as before: cloud lock-in, missing UI, no Windows support, or wanting integrated tracking and orchestration. If those pain points have not affected your team, Metaflow under Anaconda is a stable choice. But if you’re already evaluating, the integration uncertainty over the next 12 to 24 months is a reason to make that decision sooner rather than later.
Which is the Best Metaflow Alternative for You?
When selecting the best Metaflow alternative, consider your team’s specific needs and constraints. Each tool offers unique advantages:
- For teams seeking end-to-end MLOps with minimal infrastructure management: ZenML offers a balance of simplicity and extensibility, allowing you to start locally and scale to production.
- For enterprise teams with Kubernetes expertise: Kubeflow provides production-grade reliability and scalability for complex ML workflows.
- For teams prioritizing developer experience: Prefect offers an intuitive Python API with excellent observability and failure handling.
- For teams focused on experiment tracking and visualization: Weights & Biases and Comet provide powerful tools for tracking, visualizing, and comparing experiments.
Quick Selection Guide by Use Case (May 2026):
- Drop-in alternative for AWS-first MLOps: ZenML or Kubeflow
- Pipelines plus tracking in one tool: ZenML
- Native Windows support required: ZenML or Prefect
- Agentic or GenAI workflows: ZenML or MLflow 3
- Kubernetes-native at enterprise scale: Kubeflow
- Experiment tracking only, not orchestration: MLflow (open source) or Neptune (managed)
- Hosted dashboards and team collaboration: Weights & Biases or Comet
- Code, data, and experiment versioning together: DagsHub
Still confused about where to get started? Book a personalized demo call with our Founder and discover how ZenML breaks you free from AWS lock-in while delivering production-ready ML pipelines with true multi-cloud flexibility.