On this page
Modern machine learning workflows generate a huge volume of experiments, models, and data. Tools in this space tackle different parts of this challenge, from experiment tracking to pipeline orchestration. Some focus on just one step, and others take care of end-to-end MLOps.
In this Neptune AI vs WandB vs ZenML comparison, we examine how these three frameworks differ in core abstractions, experiment tracking capabilities, integration options, and pricing.
Whether you’re an ML engineer needing a robust experiment tracker or a developer seeking an end-to-end MLOps solution, understanding their strengths will help you choose the right tool for your needs.
Neptune AI vs WandB vs ZenML: Key Takeaways
🧑💻 Neptune AI: A dedicated experiment tracking platform for logging model metrics, parameters, artifacts, and model versions. Neptune pioneered collaboration in experiment tracking, providing a central hub to organize ML runs and compare results. However, as of late 2025, it’s in transition: Neptune has been acquired by OpenAI and is winding down its public service (no new sign-ups) by March 2026.
🧑💻 WandB: A popular experiment tracking and model management tool launched in 2018. WandB offers a full suite of features like experiment logging, rich visualizations, hyperparameter sweeps, dataset and model artifact versioning, and even a model registry.
🧑💻 ZenML: An open-source MLOps framework focused on pipeline-centric workflows. Unlike Neptune and WandB, which center on experiment runs, ZenML treats your ML workflows as a pipeline of steps - enabling reproducible, end-to-end pipelines with built-in tracking data, models, artifacts, metadata, and more.
Neptune AI vs WandB vs ZenML: Maturity and Lineage
When you pick an experiment tracker to sit in the middle of your stack, you’re also choosing its history, owners, and community. Maturity, licensing, and stewardship all shape the risk profile just as much as features or UI.
The table below summarizes the maturity metrics for Neptune AI, WandB, and ZenML as of late 2025.
| Metric | Neptune AI | Weights & Biases | ZenML |
|---|---|---|---|
| First public release | Prototype in 2016; first external version around 2017–2018 | Launched around 2018 as an experiment-tracking platform | Open-source release in late 2020; company founded in 2021 |
| Primary license | Proprietary SaaS; client under Apache 2.0 | MIT-licensed client + proprietary SaaS backend | Apache 2.0 |
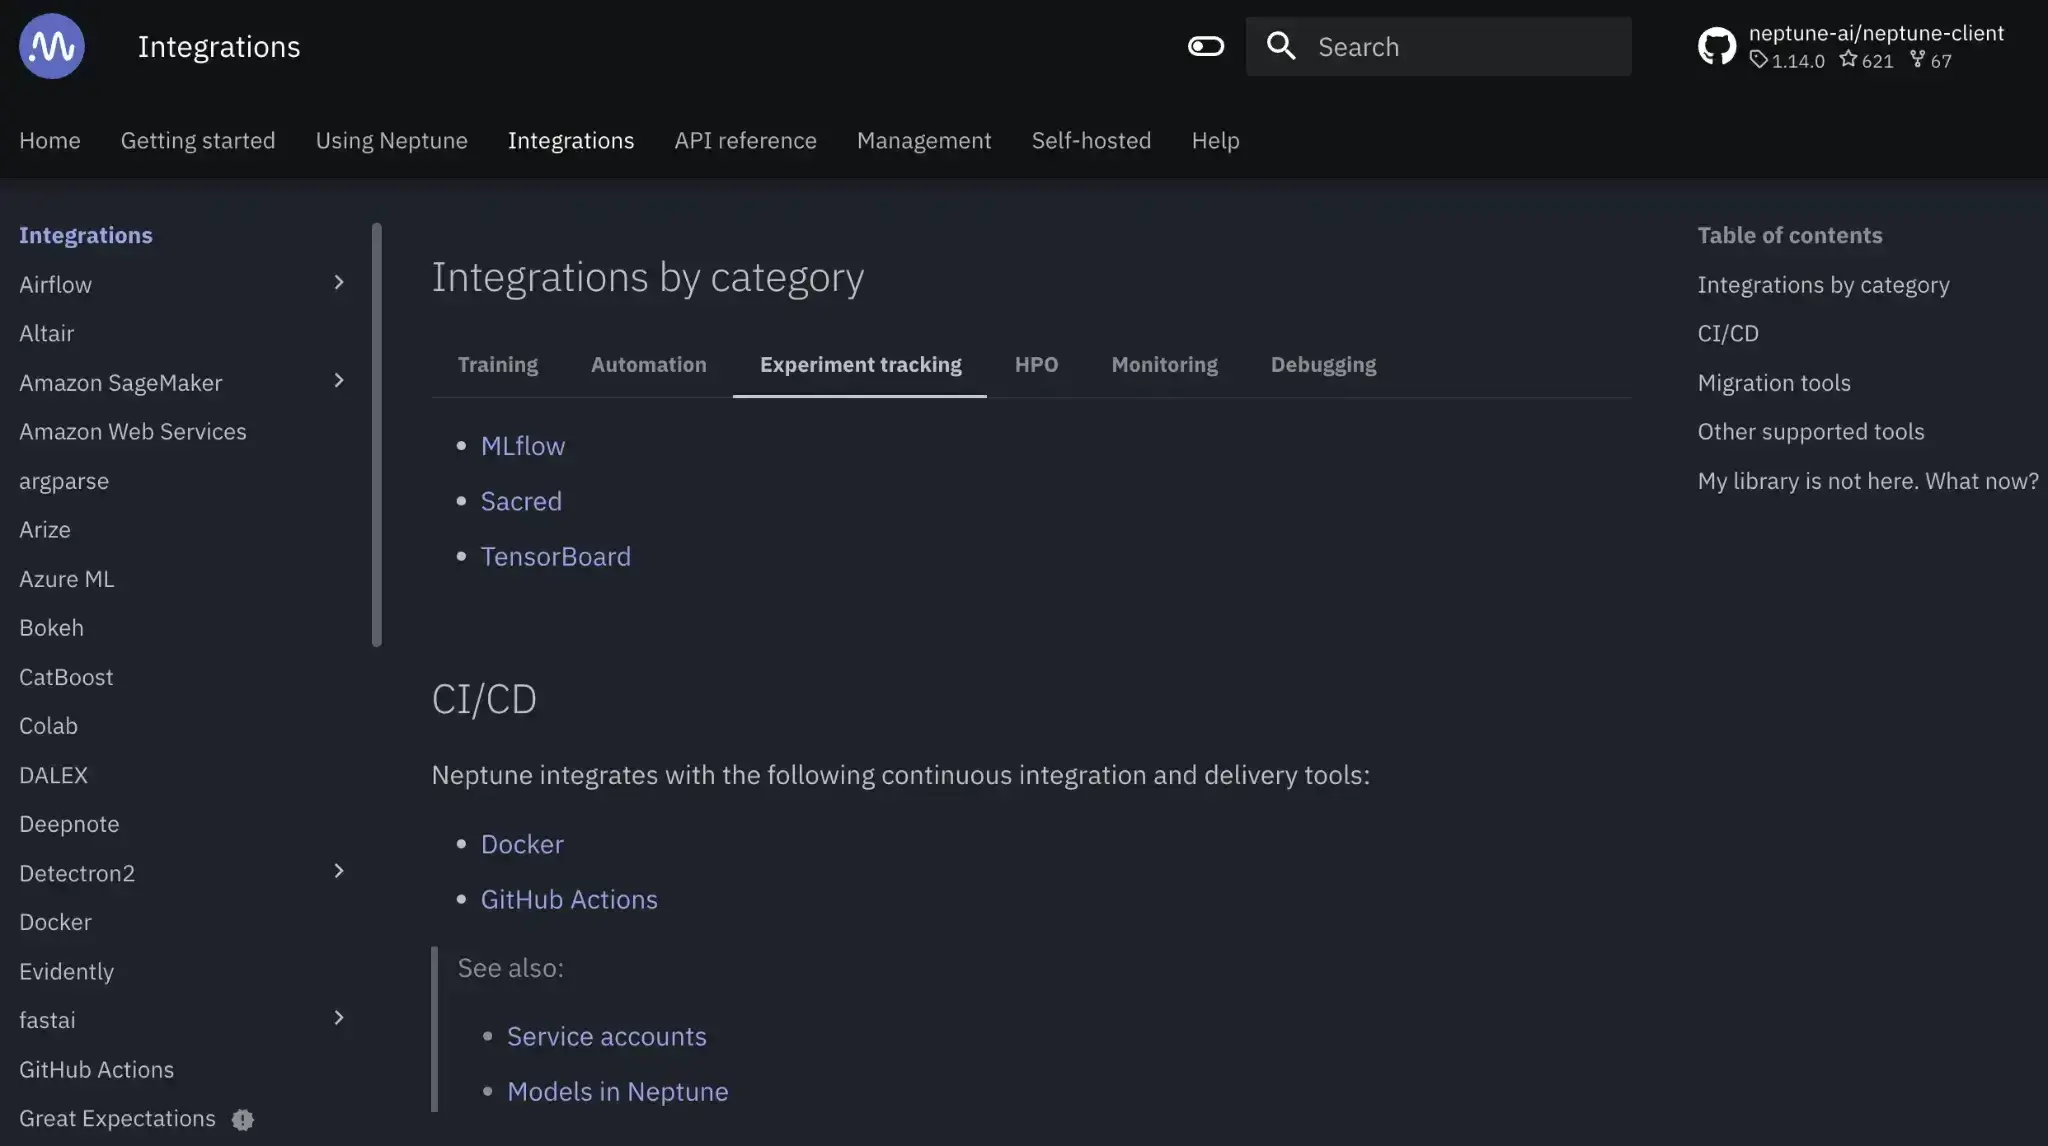
| GitHub stars | ~620+ (client repo) | ~10.6k+ | ~5.1k+ |
| Forks | ~67 | ~790+ | ~560+ |
| Commit activity | ~2,100+ | ~8,700+ | ~8,300+ |
Neptune started life as an internal tool at deepsense.ai before spinning out in 2018, and is now being acquired by OpenAI, which centralizes stewardship but also signals strong adoption in large-scale model training workflows.
W&B has grown since 2018 as an independent company focused on experiment tracking and model management, with a very active open-source client and a large user base reflected in its GitHub footprint.
ZenML is younger as a company (2021) but has moved quickly: its Apache-licensed core has thousands of stars and a commit history comparable to WandB, reflecting rapid iteration on pipelines, orchestration, and experiment tracking in one platform.
Neptune AI vs WandB vs ZenML: Features Comparison
Let’s compare the core features of Neptune, W&B, and ZenML across key dimensions. Below is a high-level overview of how their core abstractions, experiment tracking and visualization, and artifact versioning stack up:
Feature 1. Core Abstractions: What are the Primary Objects or Concepts You Manage?
Tracking experiments is the foundation of any ML workflow because it gives teams a reproducible record of what they ran, which code or parameters produced which results, and how models evolved over time.
Neptune AI
Neptune AI is organized around runs (experiments) and projects. Every training run is tracked as a Run in Neptune’s API, and runs are grouped into projects. The platform doesn’t define pipelines or steps natively; you instrument your training scripts with Neptune’s logging calls, and each script execution becomes a tracked run.
It comes with a model registry concept where models and their versions can be logged and registered. Key abstractions include the workspace, projects, and runs under it.
Neptune automatically captures run metadata like git commit, parameters, metrics, and more, and lets you explicitly log artifacts or model files.
All in all, experiments are first-class, grouped by Project. Artifacts and models are associated with runs for versioning.
WandB
WandB is also centered on runs and projects. You initialize a WandB run typically with wandb.init(project="my-project") and then log metrics, parameters, and artifacts to that run.
WandB has an entity and project hierarchy similar to Neptune’s workspace/project. There is no built-in notion of a pipeline with multiple seats - instead, the platform focuses on experiment runs and aggregates them via the UI for comparison.
Core objects include:
- WandB Run
- Config - hyperparameter dictionary attached to a run
- Artifact - versioned dataset and model file
- WandB model registry
The model registry allows you to promote certain artifact versions as ‘registered models’ with stages like production, staging, etc.
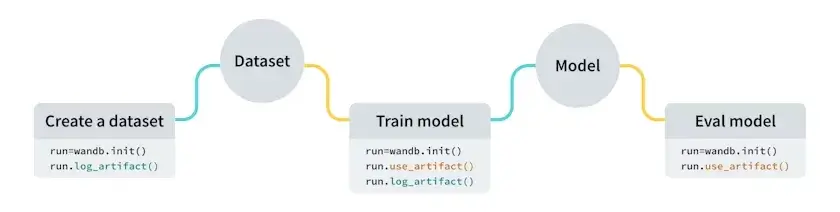
W&B provides a system of record for experiments and their outputs. Everything is tied to runs; for example, one training script execution equals one run, which can produce model and dataset artifacts logged via run.log_artifact().
ZenML
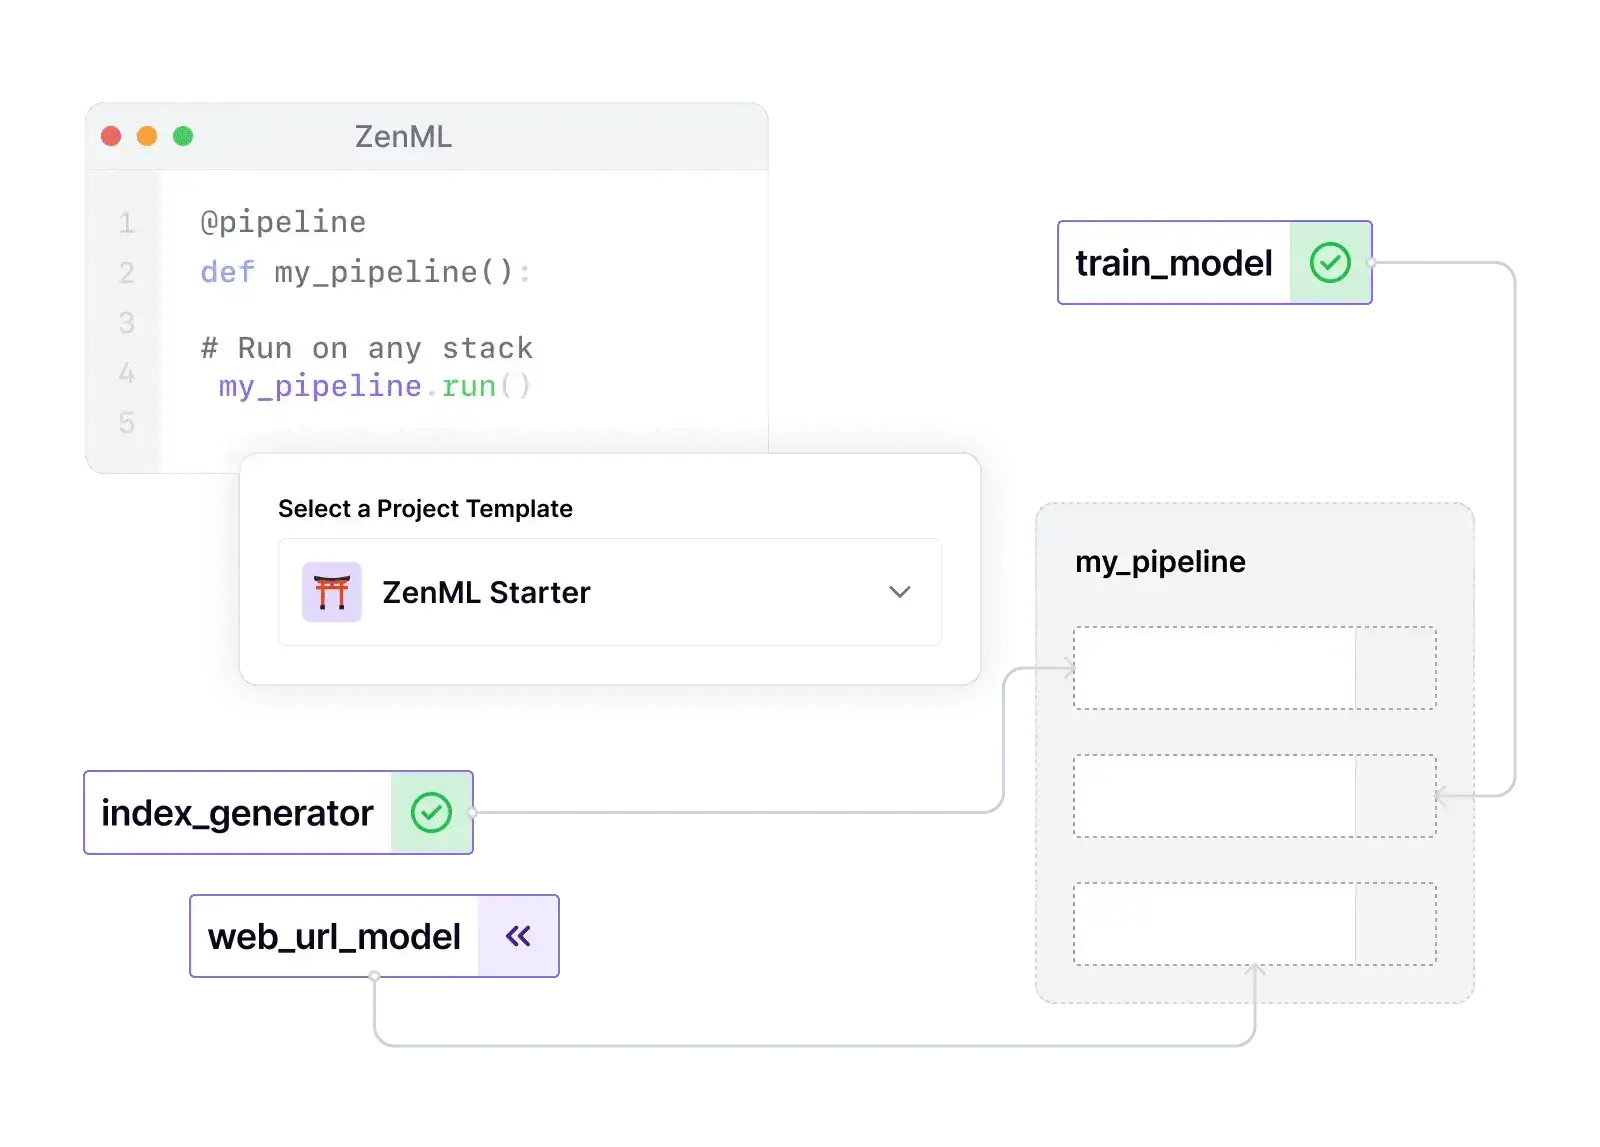
ZenML is built around pipelines and steps as first-class abstractions. You define your ML workflow as a @pipeline function composed of @step functions (each step is a unit of work, like data loading, training, evaluation, etc.).
When you run a pipeline, ZenML executes each step and tracks the entire pipeline run (including each step’s inputs/outputs) automatically. This means the primary object you manage is the pipeline (which can be versioned and rerun), and steps within pipelines.
ZenML still cares about experiments and runs, but they are handled in the context of pipeline executions (each pipeline run is analogous to an experiment). Artifacts are a core abstraction: any output returned by a step is an artifact that ZenML stores and versions in an artifact store.
You don’t manually log artifacts as you would in W&B; ZenML captures them automatically when a step completes. ZenML also introduces the concept of Stacks/Stack Components – a way to configure your pipeline’s infrastructure.
For model management, the framework doesn’t force a proprietary model registry – instead, you can either treat models as artifacts (ZenML will version them in the artifact store) or integrate an external model registry.
Feature 2. Experiment Tracking and Visualization - How Do They Log and Visualize Experiments?
Versioning datasets, models, and intermediate artifacts ensures that every step of the ML lifecycle is reproducible and traceable. This matters because production issues usually come from mismatched data versions or silently changed features, not from the model code itself.
Neptune AI
The platform emphasizes experiment tracking via a lightweight client API.
You initialize a Neptune run (neptune.init_run() or similar) with your project, then log metrics, parameters, images, etc., through that run object (e.g., run["train/accuracy"].log(0.95)).
Neptune automatically tracks standard metadata like hardware utilization and source code by default.
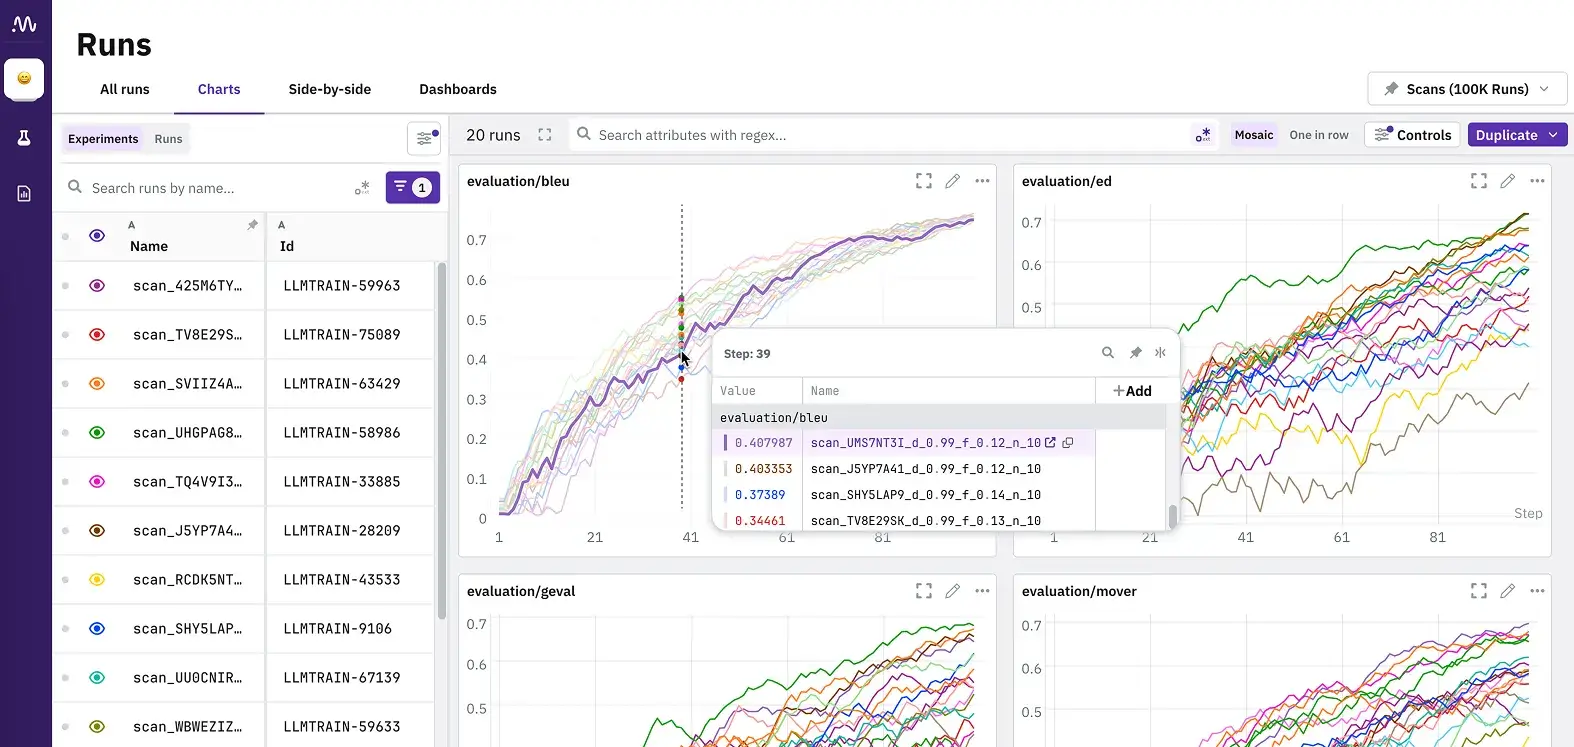
If we talk about visualization, Neptune provides a web app where you can see a dashboard of runs for each project. It lets you compare runs side-by-side, visualize metric curves, and even create custom dashboards/reports combining plots of multiple experiments.
Each run’s logged data is viewable in real-time; for instance, as your training script logs loss over epochs, Neptune’s UI updates the loss plot. What’s more, the platform also supports interactive visualizations and notebook checkpoints – you can link notebooks or source code snapshots to runs for reproducibility.
In terms of experiment comparison, Neptune’s UI lets you filter and sort runs by parameters or tags, and offers a parallel coordinate plot to compare hyperparam values vs. metrics across runs.
WandB
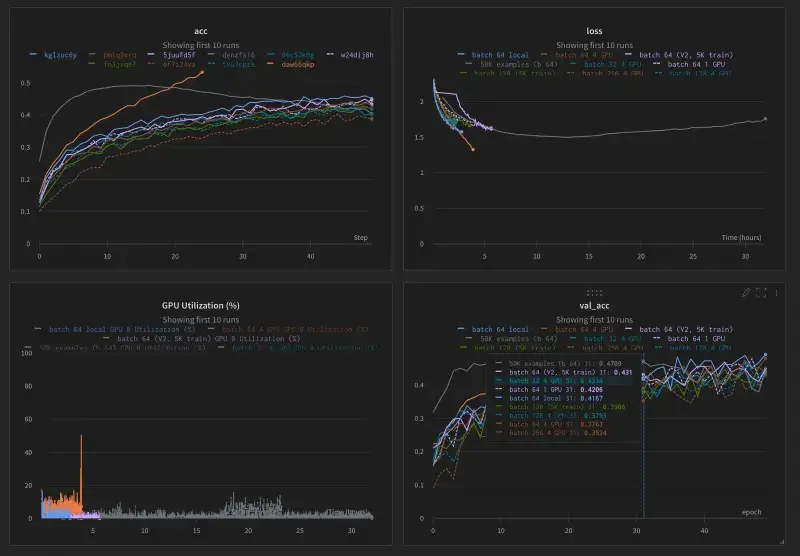
WandB excels at real-time experiment tracking and rich visualizations. With just a few lines of code, the framework logs all your key metrics and media and streams them on an interactive web dashboard.
A WandB panel shows each run as a row with columns for metrics; you can hover to see training curves or click into a run for full detail.
The UI of the tool is quite polished; you get charts for metrics, tables for data samples, and even 3D volume renders for things like CNN filters if logged. It also supports live updates, so you can watch your model training progress remotely. Here’s how to track experiments with WandB:
- Initialize a run and pass in the hyperparameters you want to track.
- Within your training loop, log metrics such as the accuracy and loss.
import wandb
import random

project="basic-intro"
config = {
    "learning_rate": 0.02,
    "architecture": "CNN",
    "dataset": "CIFAR-100",
    "epochs": 10,
}

with wandb.init(project=project, config=config) as run:
  # This block simulates a training loop logging metrics
  epochs = 10
  offset = random.random() / 5
  for epoch in range(2, epochs):
      acc = 1 - 2 ** -epoch - random.random() / epoch - offset
      loss = 2 ** -epoch + random.random() / epoch + offset

      # 2️. Log metrics from your script to W&B
      run.log({"acc": acc, "loss": loss})
For visualizations, beyond basic charts, WandB has specialized features like:
- Table data type to log and view datasets or model predictions in a tabular format
- Media panels for images, audio, and video logged during experiments
- Custom Reports where you can drag-and-drop plots and write commentary to share results.
ZenML
ZenML takes a slightly different approach because it’s pipeline-centric. Experiment tracking in ZenML is more implicit: when you run a pipeline, ZenML records the run metadata (which steps ran, what parameters were used, artifact URIs, etc.) to its backend.
ZenML by itself doesn’t produce the kind of scalar metric charts that Neptune or WandB do unless you use an integration.
In fact, ZenML encourages using an experiment tracker integration for metrics – for example, you can add WandB or MLflow as an ‘experiment tracker’ component in your ZenML stack, and then metrics logged inside steps will be forwarded to those systems.
This means you can get the best of both worlds: use ZemML to orchestrate and version your pipeline, and still log detailed metrics to an experiment tracker like WandB or Neptune.
With ZenML Pro, you get ZenML’s native dashboard, which provides visualizations focused on pipelines. In the dashboard, you can see the DAG of each pipeline run, a timeline view of step executions, and, for each artifact, ZenML can generate a visualization preview.
ZenML automatically creates basic visualizations for common artifact types and stores them – for instance, if a step outputs a matplotlib chart, ZenML can capture that plot as a visualization artifact. The dashboard also offers an ‘Experiment Comparison’ feature (in ZenML Pro) to compare metadata across pipeline runs in a table view.
For a team focused on ML pipelines, ZenML’s tracking ensures no step output or config goes unrecorded, and its visualizations help confirm the pipeline ran as expected.
But if your main need is custom charts and metric comparisons, you’d likely use ZenML in tandem with a tracker plugin.
Feature 3. Artifact and Data Versioning - How Do These Frameworks Handle Datasets and Models?
ML systems break when pipelines are stitched together manually. Orchestration defines how data flows, how steps are executed, and how failures are handled, turning experimentation into a stable production process.
Neptune AI
Neptune AI provides first-class artifact logging and versioning support. The framework lets you log any file or directory as an artifact of a run using run["artifacts/my_model"].upload("model.pkl").
These artifacts are stored with a hash and tracked in the Neptune project. Neptune’s UI has an Artifacts tab where you can browse all artifacts logged across runs. It allows you to compare artifacts between runs, which comes in handy when you want to see how two model binaries differ or compare output files.
The platform also had features for dataset versioning – for instance, logging a dataset artifact, and then Neptune can track versions of that dataset across runs or as a project-level artifact.
Neptune also ensures that each artifact has a unique identifier (often a hash or UUID) and stores metadata like size, checksum, etc., so you have a verifiable lineage of data.
Its legacy model registry (Neptune 2.x) allowed registering models separately, but in Neptune 3, the approach was to log models as artifacts within runs and use custom fields to mark stages.
Regardless, Neptune makes it easy to version control any piece of data associated with experiments. When viewing a run, you can see all artifacts it logged and download them, or use the API to download artifacts programmatically for reuse.
WandB
WandB’s Artifact system is one of its standout features. You can think of a WandB Artifact as a versioned folder or file that is tracked by name and version.
For example, you might create an artifact for a dataset: ‘MNIST: v0’ and another for a trained model ‘Classifier:c=v0.’ In code, you instantiate an artifact with wandb.Artifact(name="Classifier", type="model"), add files to it, and call run.log_artifact(artifact).
WandB will upload the files and assign a version to them. These artifacts live in WandB’s cloud and can be used by future runs; you can fetch an artifact by name/version using: run.use_artifact("Classifier:latest").
In the WandB web UI, there’s an Artifacts section where you can browse all datasets and models, see their versions, and even promote certain versions to ‘aliases.’
ZenML
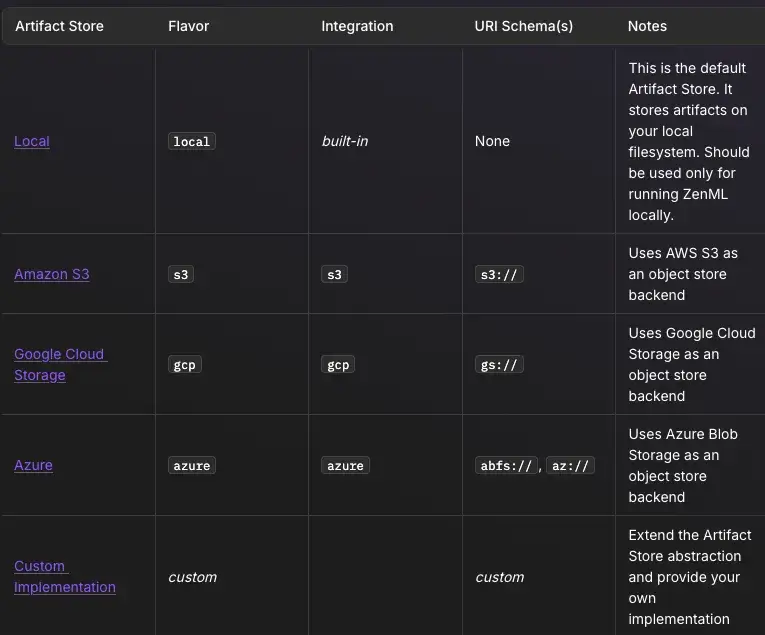
Since ZenML pipelines pass data between steps, the platform introduces an Artifact Store as part of its infrastructure. By default, outputs of steps (artifacts) are stored in the artifact store. The store could be a local folder, an S3 bucket, GCS, etc., depending on your stack configuration.
Each artifact is automatically given a version number or unique ID every time a pipeline runs. For example, if your pipeline’s first run produces an artifact “iris_dataset” version 1, the next run that produces “iris_dataset” will get version 2, and so on. All this happens without extra code - ZenML’s engine assigns these versions and keeps a catalog of artifacts.
Any value returned from a step becomes an artifact:“
from zenml import pipeline, step
import pandas as pd

@step
def create_data() -> pd.DataFrame:
    """Creates a dataframe that becomes an artifact."""
    return pd.DataFrame({
        "feature_1": [1, 2, 3],
        "feature_2": [4, 5, 6],
        "target": [10, 20, 30]
    })

@step
def create_prompt_template() -> str:
    """Creates a prompt template that becomes an artifact."""
    return """
    You are a helpful customer service agent.

    Customer Query: {query}
    Previous Context: {context}

    Please provide a helpful response following our company guidelines.
    """
You can then query or list artifacts via the CLI or API (e.g., zenml artifact list) to see all artifacts, and each artifact will have versions.
If you want to promote or manually manage versions, ZenML allows custom version labels via an ArtifactConfig if needed, but generally, it will increment versions for you.
ZenML’s approach means that if you retrain a model with slightly different data, you will get a new artifact (say “model:version 3”) rather than overwriting the old one.
What’s more, ZenML even extracts metadata and can create visualizations for artifacts. For example, it might save a histogram image for a DataFrame or weights summary for a model artifact. This functionality of ZenML is quite holistic: every output of every step is tracked, versioned, and can be reproduced by re-running the pipeline with the same inputs.
If combining ZenML with an experiment tracker, you can log the metrics to WandB, but the actual data and model files would reside in ZenML’s artifact store, giving you a double layer of tracking.
Bottom line: Neptune and WandB explicitly provide artifact management interfaces, while ZenML bakes artifact versioning into its pipeline engine, making it implicit and automatic.
Neptune AI vs W&B vs ZenML: Integration Capabilities
Neptune AI
Neptune focuses on framework-level and experiment-level integrations. You plug it into almost any Python training loop and start logging with callbacks or a few API calls.
Key integrations:
- PyTorch, PyTorch Lightning, TensorFlow/Keras, scikit-learn, XGBoost, LightGBM
- Optuna, Ray Tune, Hyperopt for HPO
- Airflow, Kubeflow Pipelines, Prefect, Kedro for orchestration
- Jupyter notebook extension and GitHub Actions/CI scripts
- REST API and Python client for custom tools and services
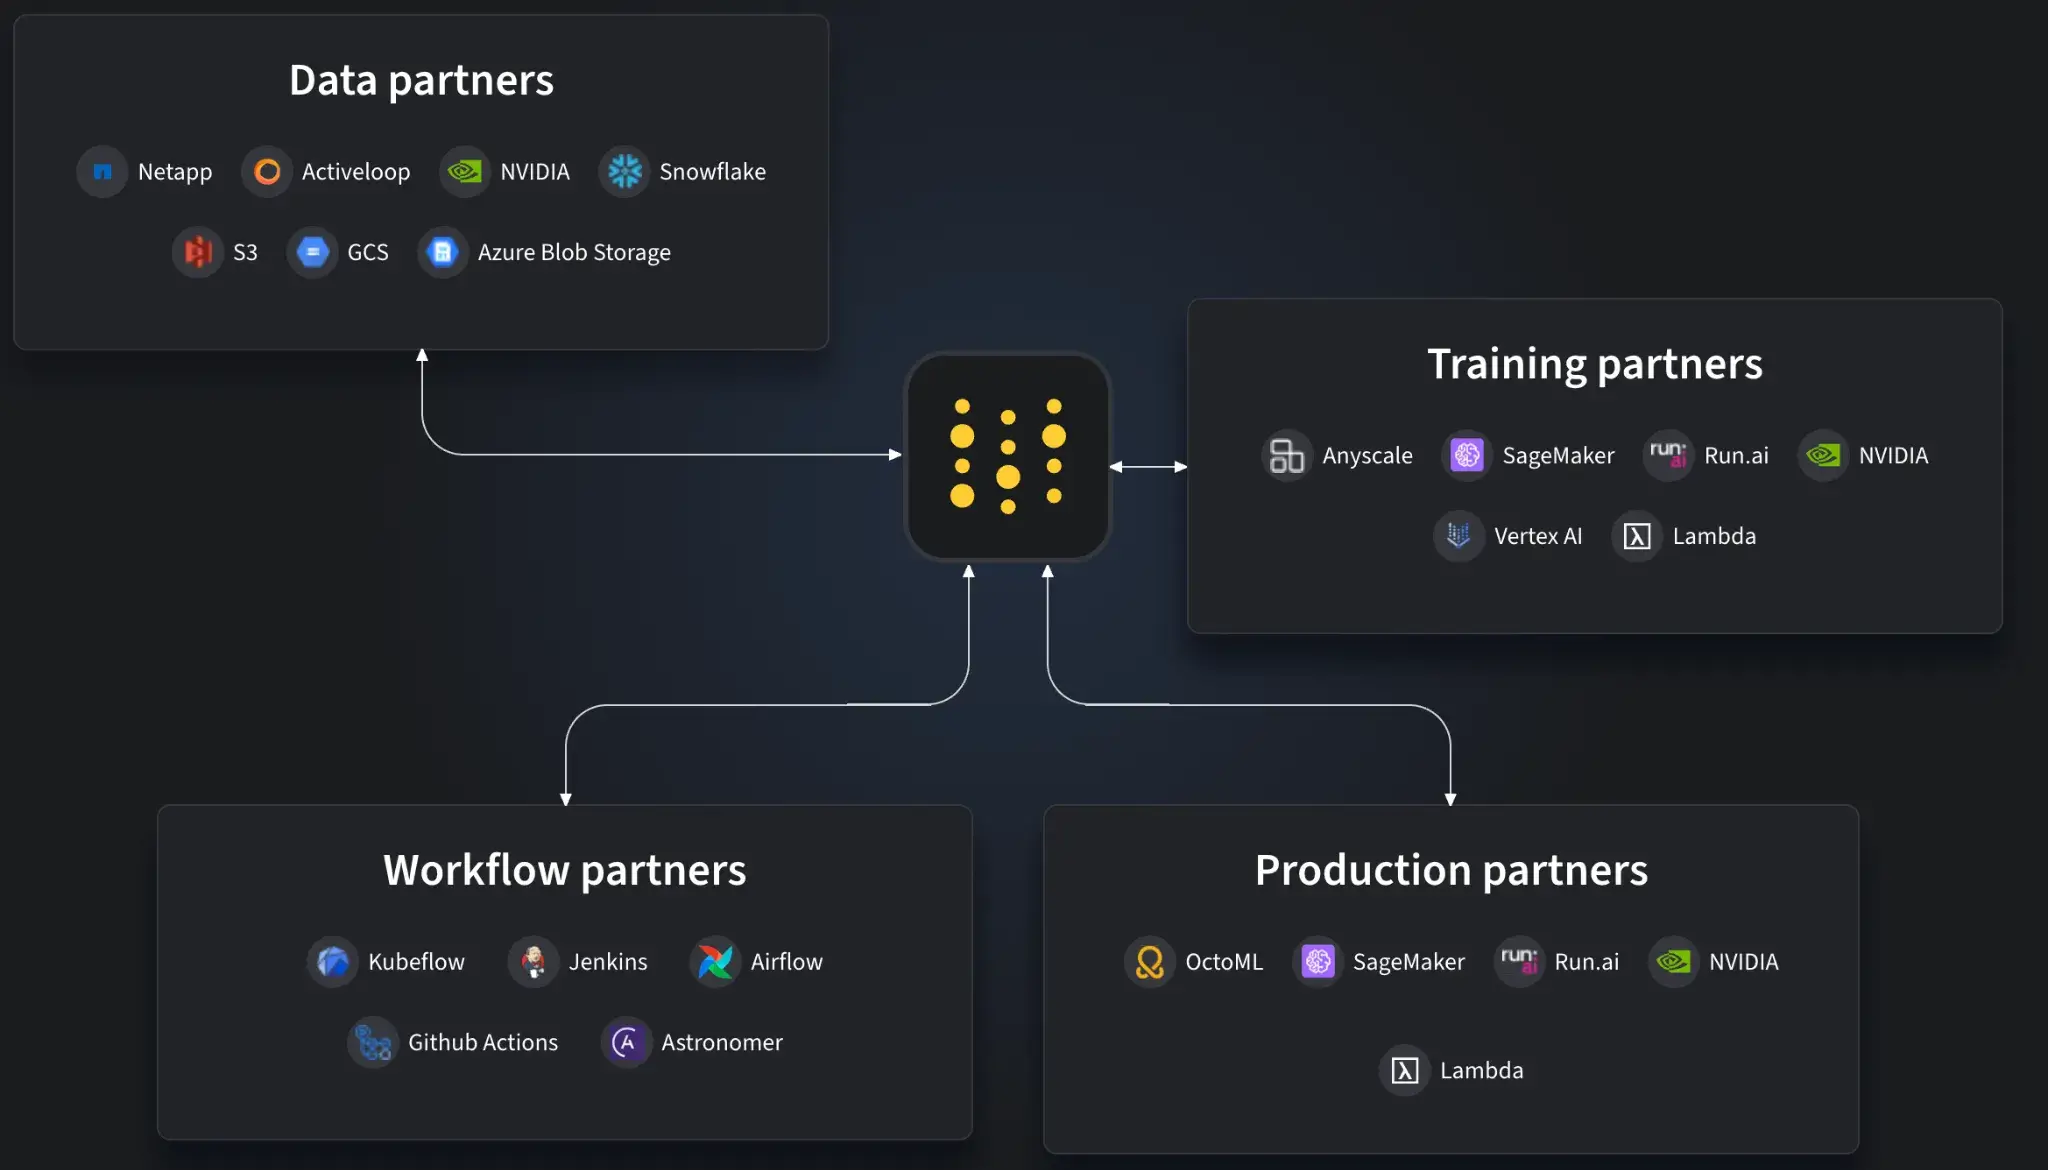
WandB
WandB is designed to sit on top of almost any ML stack as the tracking and visualization layer. Most frameworks and platforms have either native or well-documented W&B hooks.
Key integrations:
- TensorFlow/Keras, PyTorch and Lightning, scikit-learn, XGBoost, Hugging Face
- Optuna, Ray Tune, and W&B Sweeps for HPO
- Airflow, Kubeflow, Prefect, Dagster for orchestration
- Google Colab, Jupyter, SageMaker, Azure ML notebooks, and jobs
- CI/CD: GitHub Actions, GitLab CI, Jenkins via API and webhooks
- WandB Artifacts and Model Registry for dataset/model versioning and deployment workflows
ZenML
ZenML is integration-heavy by design through its Stack abstraction. You mix and match tools, and ZenML coordinates them inside reproducible pipelines.
Key integrations:
- Orchestrators: Airflow, Kubeflow, Kubernetes, AWS Step Functions, local runners
- Experiment trackers: WandB, MLflow, Neptune, TensorBoard
- Artifact stores: S3, GCS, Azure Blob Storage, local file systems
- Model deployers: Seldon, BentoML, KServe, SageMaker, Ray Serve
- Data and quality: Feast, Great Expectations, whylogs, Evidently, vector stores
- LLM tooling: LangChain, LlamaIndex, and other LLM/RAG components
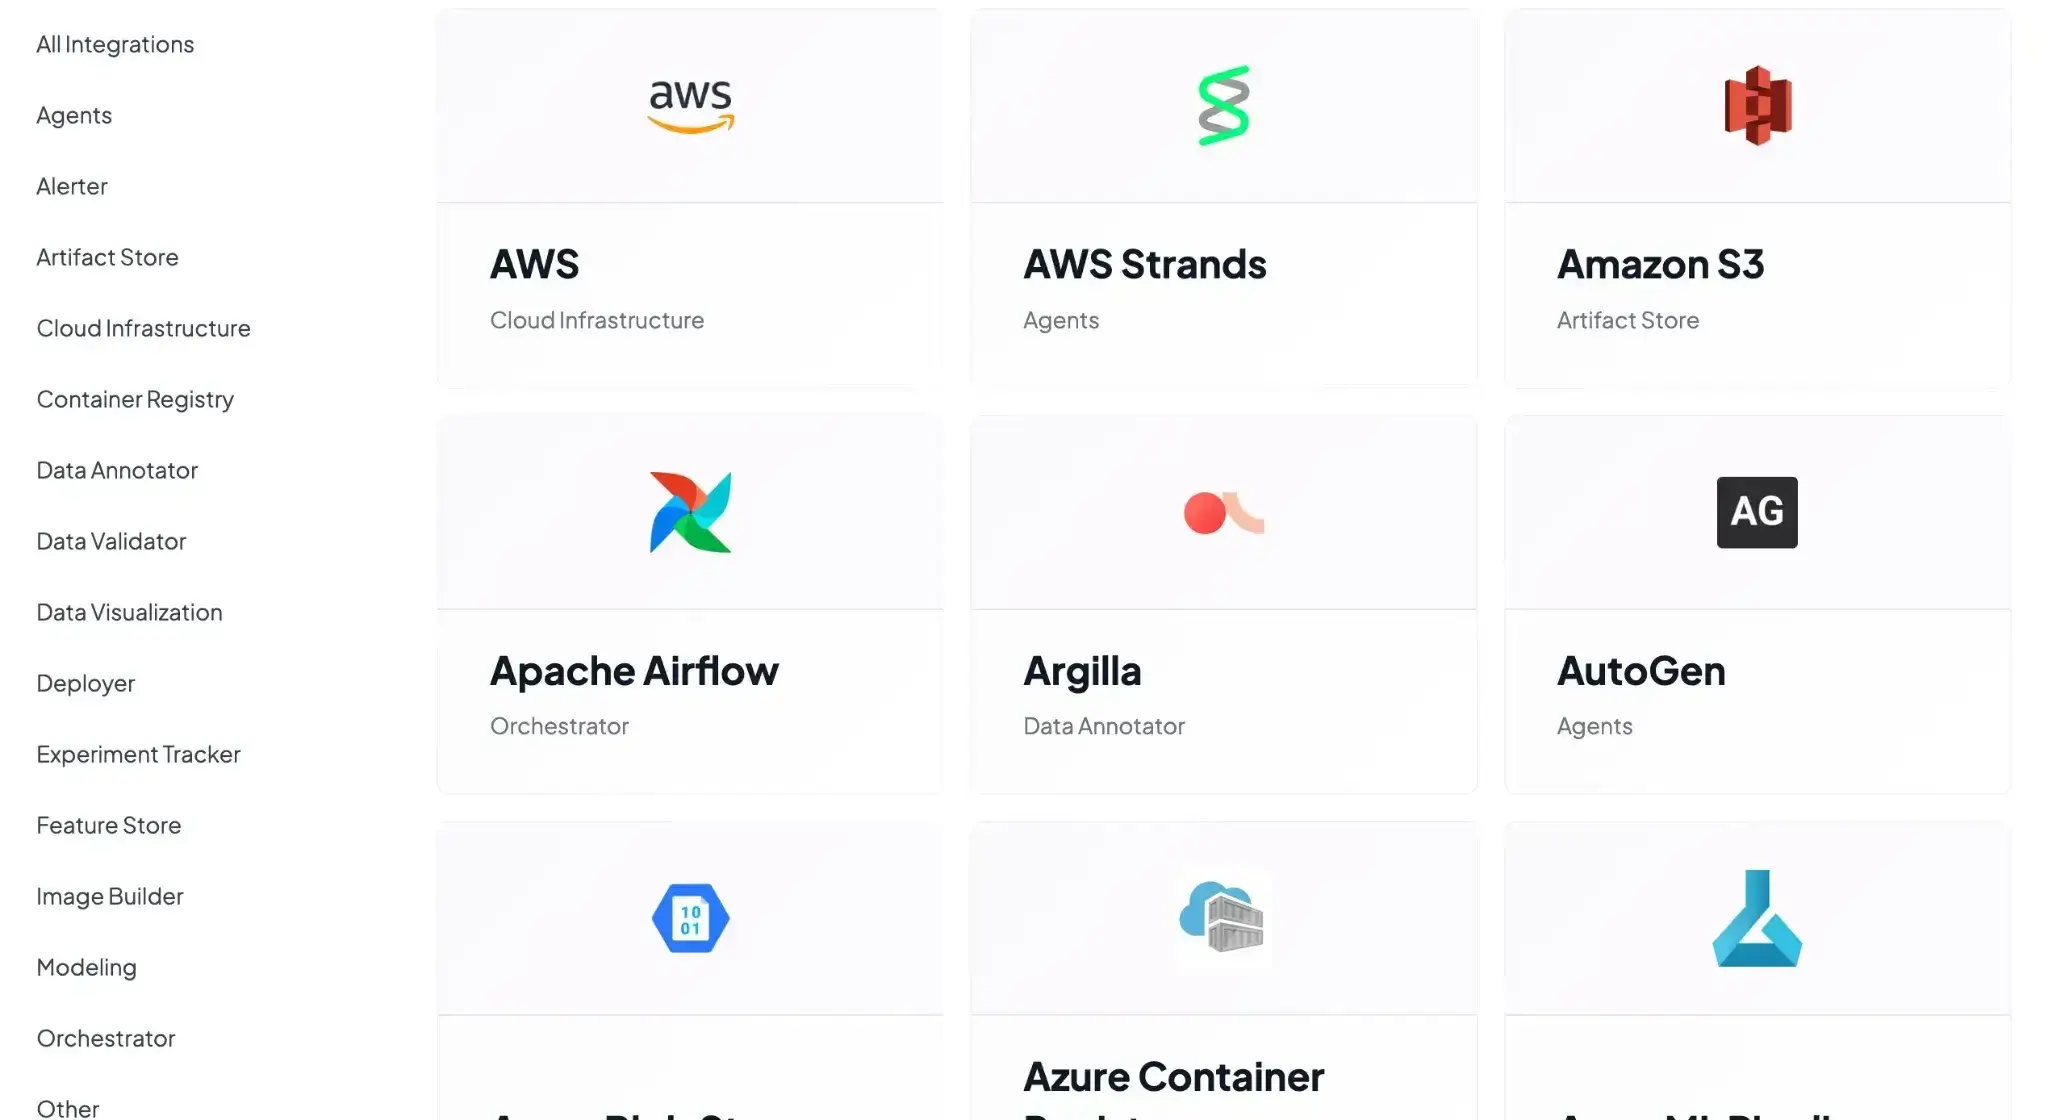
ZenML is the most flexible of the three. It acts as the central hub that wires all these tools into one pipeline workflow without forcing a specific cloud, tracker, or model-serving stack.
Neptune AI vs WandB vs ZenML: Pricing Comparison
Neptune AI
Neptune AI previously offered a free plan for individuals and academics. It also had three paid plans to choose from.
However, as of the acquisition announcement, new sign-ups (including free trials) have been permanently disabled.
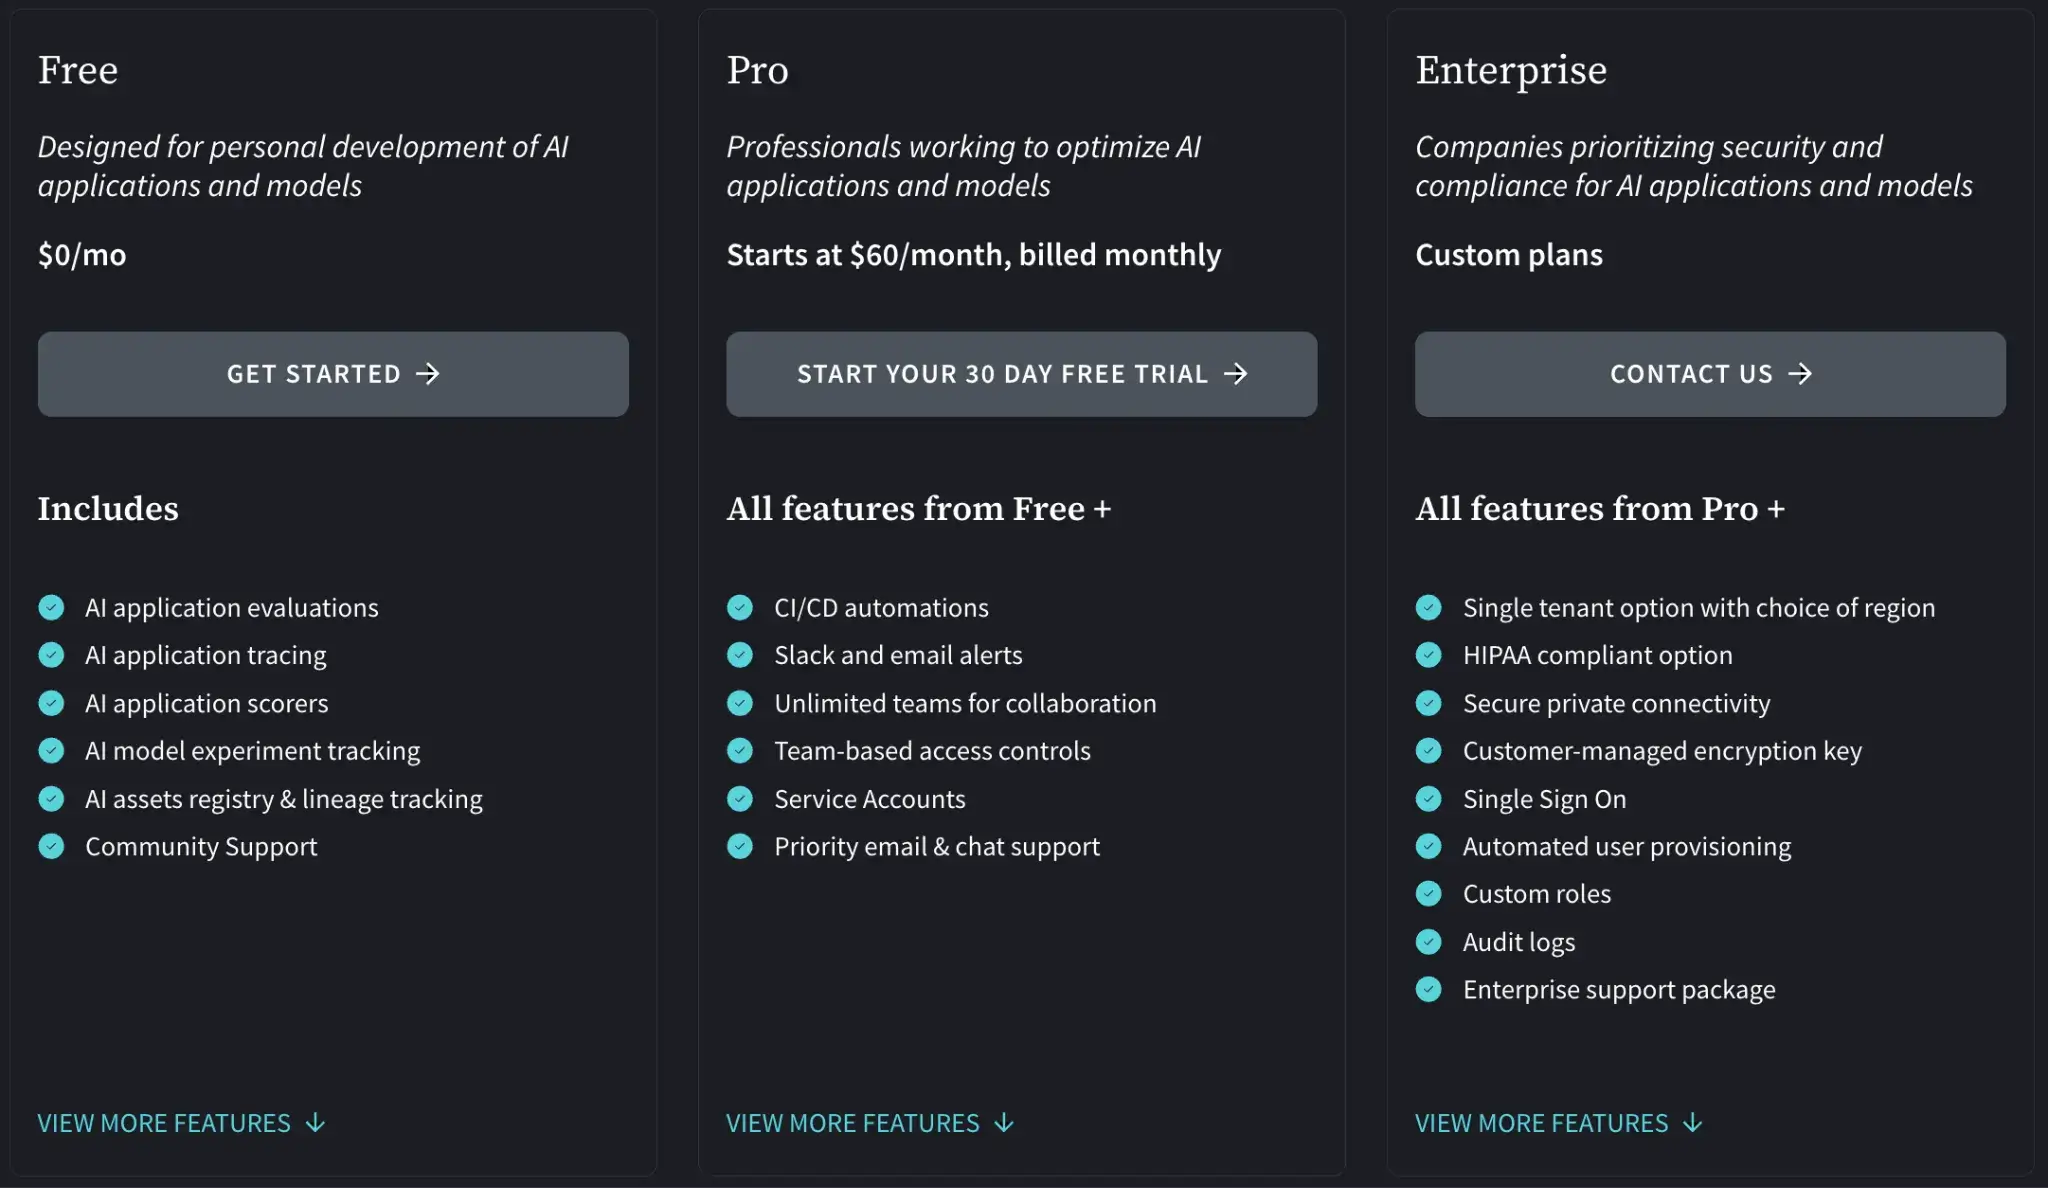
WandB
WandB has a free plan, which you can cloud-host or host privately. But if you want premium features and priority support, it also offers paid plans:
- Pro: $60 per month
- Enterprise: Custom pricing
WandB also offers an Advanced Enterprise plan (custom pricing) for hosting the framework privately.
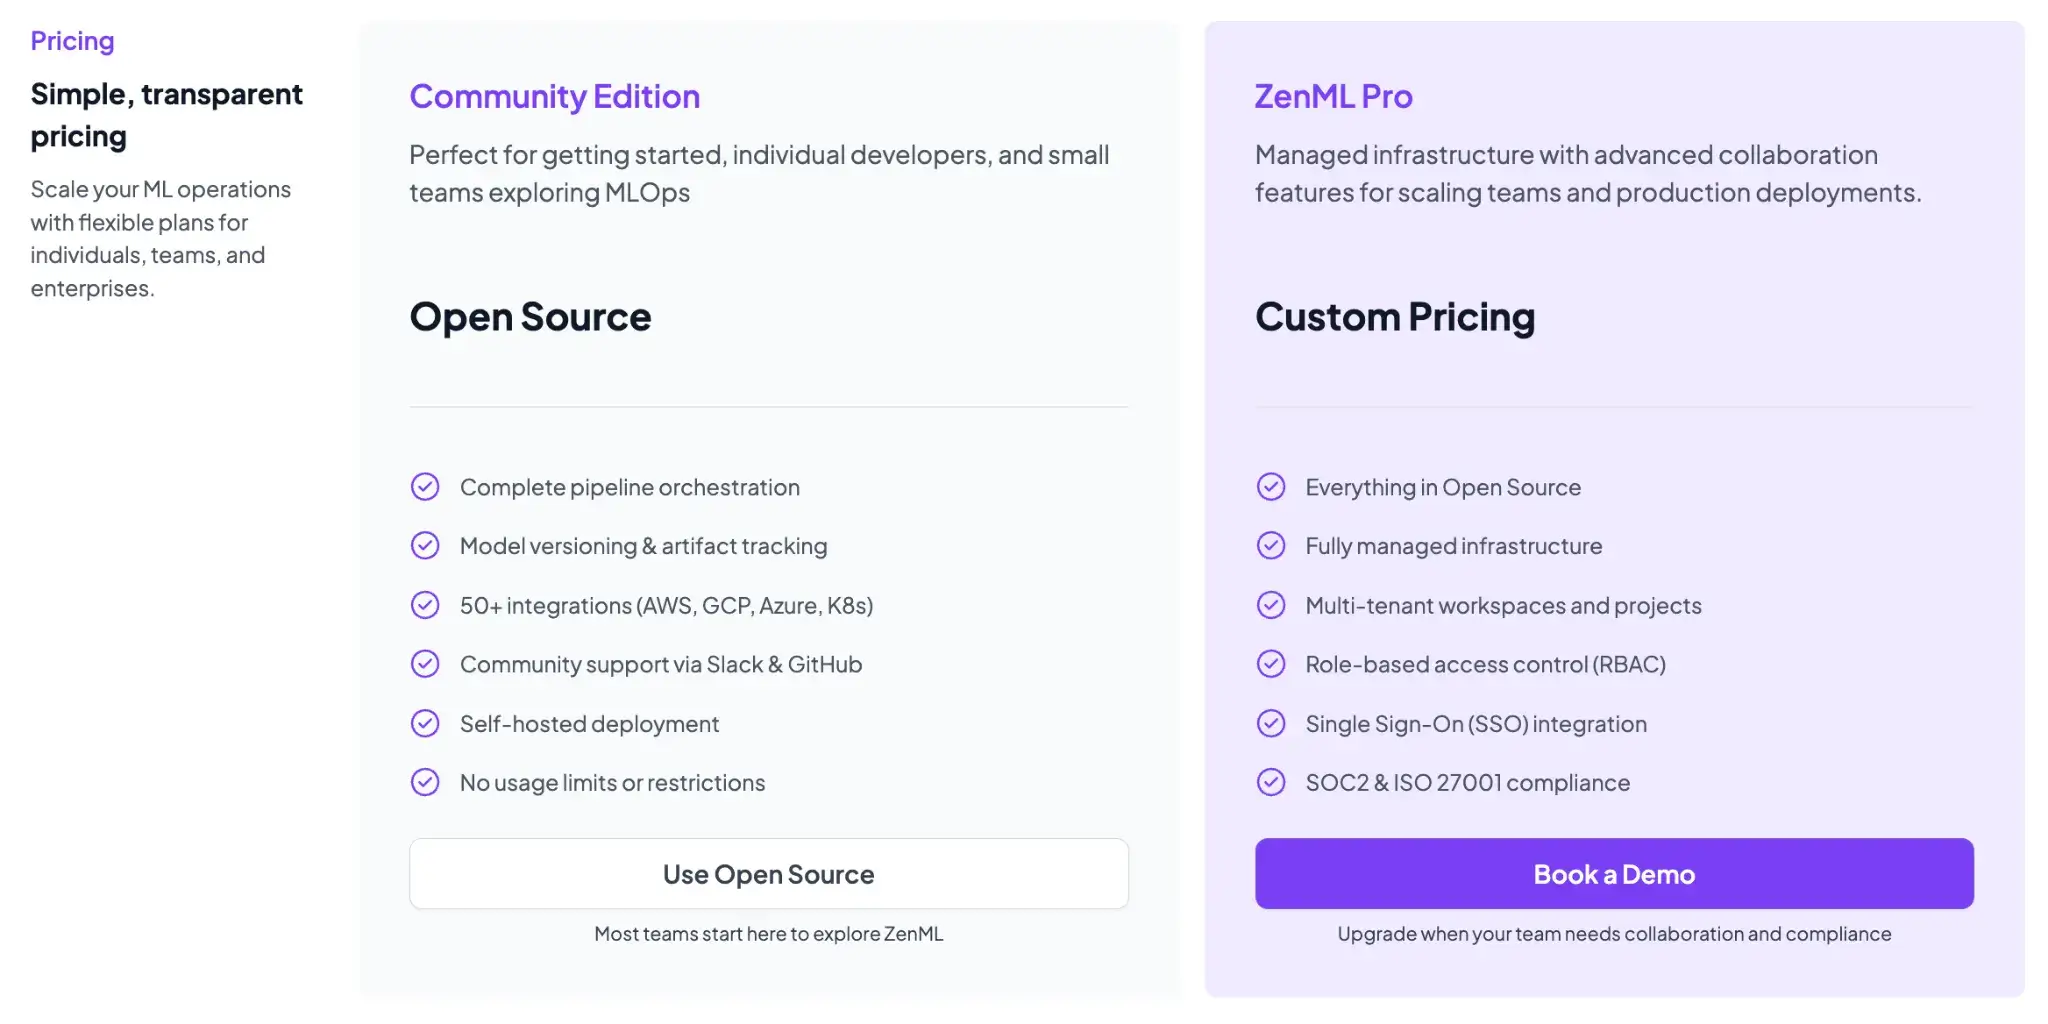
ZenML
ZenML is free and open-source (Apache 2.0 License). The core framework, including the tracking, orchestration, and upcoming dashboard, can all be self-hosted at no cost. For teams that want a managed solution or enterprise features, ZenML offers business plans (ZenML Cloud and ZenML Enterprise) with custom pricing based on deployment and scale.
These paid plans include features like SSO, role-based access control, premium support, and hosting, but all the core functionality remains free in the open-source version. Essentially, you can start with ZenML’s free tier and only consider paid options if you need advanced collaboration or want ZenML to manage the infrastructure for you.
Which MLOps Framework Works Best for You?
Choosing between Neptune, WandB, and ZenML comes down to your specific needs and the stage of your ML workflow:
- If you only need experiment tracking and want a proven, plug-and-play solution, WandB is a frontrunner. It has great features that help research and ML teams track experiments with minimum fuss and superb visualizations.
- If you need a full pipeline orchestration solution and value open-source flexibility, ZenML is the best in the business. The tool is ideal for engineering-focused teams looking to productionize ML workflows with reproducibility. It addresses the ‘outer loop’ of MLOps – pipeline automation, artifact tracking across steps, and integration of many tools into one coherent framework.
- If you were considering Neptune as a standalone experiment tracker, at this point, it’s not a viable long-term option given its acquisition and shutdown timeline. Current Neptune users should migrate their experiment data to alternatives like ZenML, WandB, or MLflow.
📚 Relevant comparison articles to read:
But remember, with ZenML, you don’t have to choose. You can keep using ZenML alongside MLflow (or Neptune, for teams still on it) since ZenML integrates seamlessly with external experiment trackers while providing a stronger, pipeline-first foundation for long-term MLOps.