On this page
LLM-powered applications are notoriously difficult to debug and manage in production. Unlike traditional software, their unpredictable nature means failures are often silent.
Traditional Application Performance Monitoring (APM) tools lack the nuances needed to handle such complexity. This is why LLM observability tools were built. These tools help you trace the entire lifecycle of every query made to your LLM.
This best LLM observability tools guide cuts through the marketing noise to provide a clear, engineer-focused breakdown of the 9 best tools on the market. We cover what each tool does, its unique strengths, pros & cons, and its pricing.
TL;DR
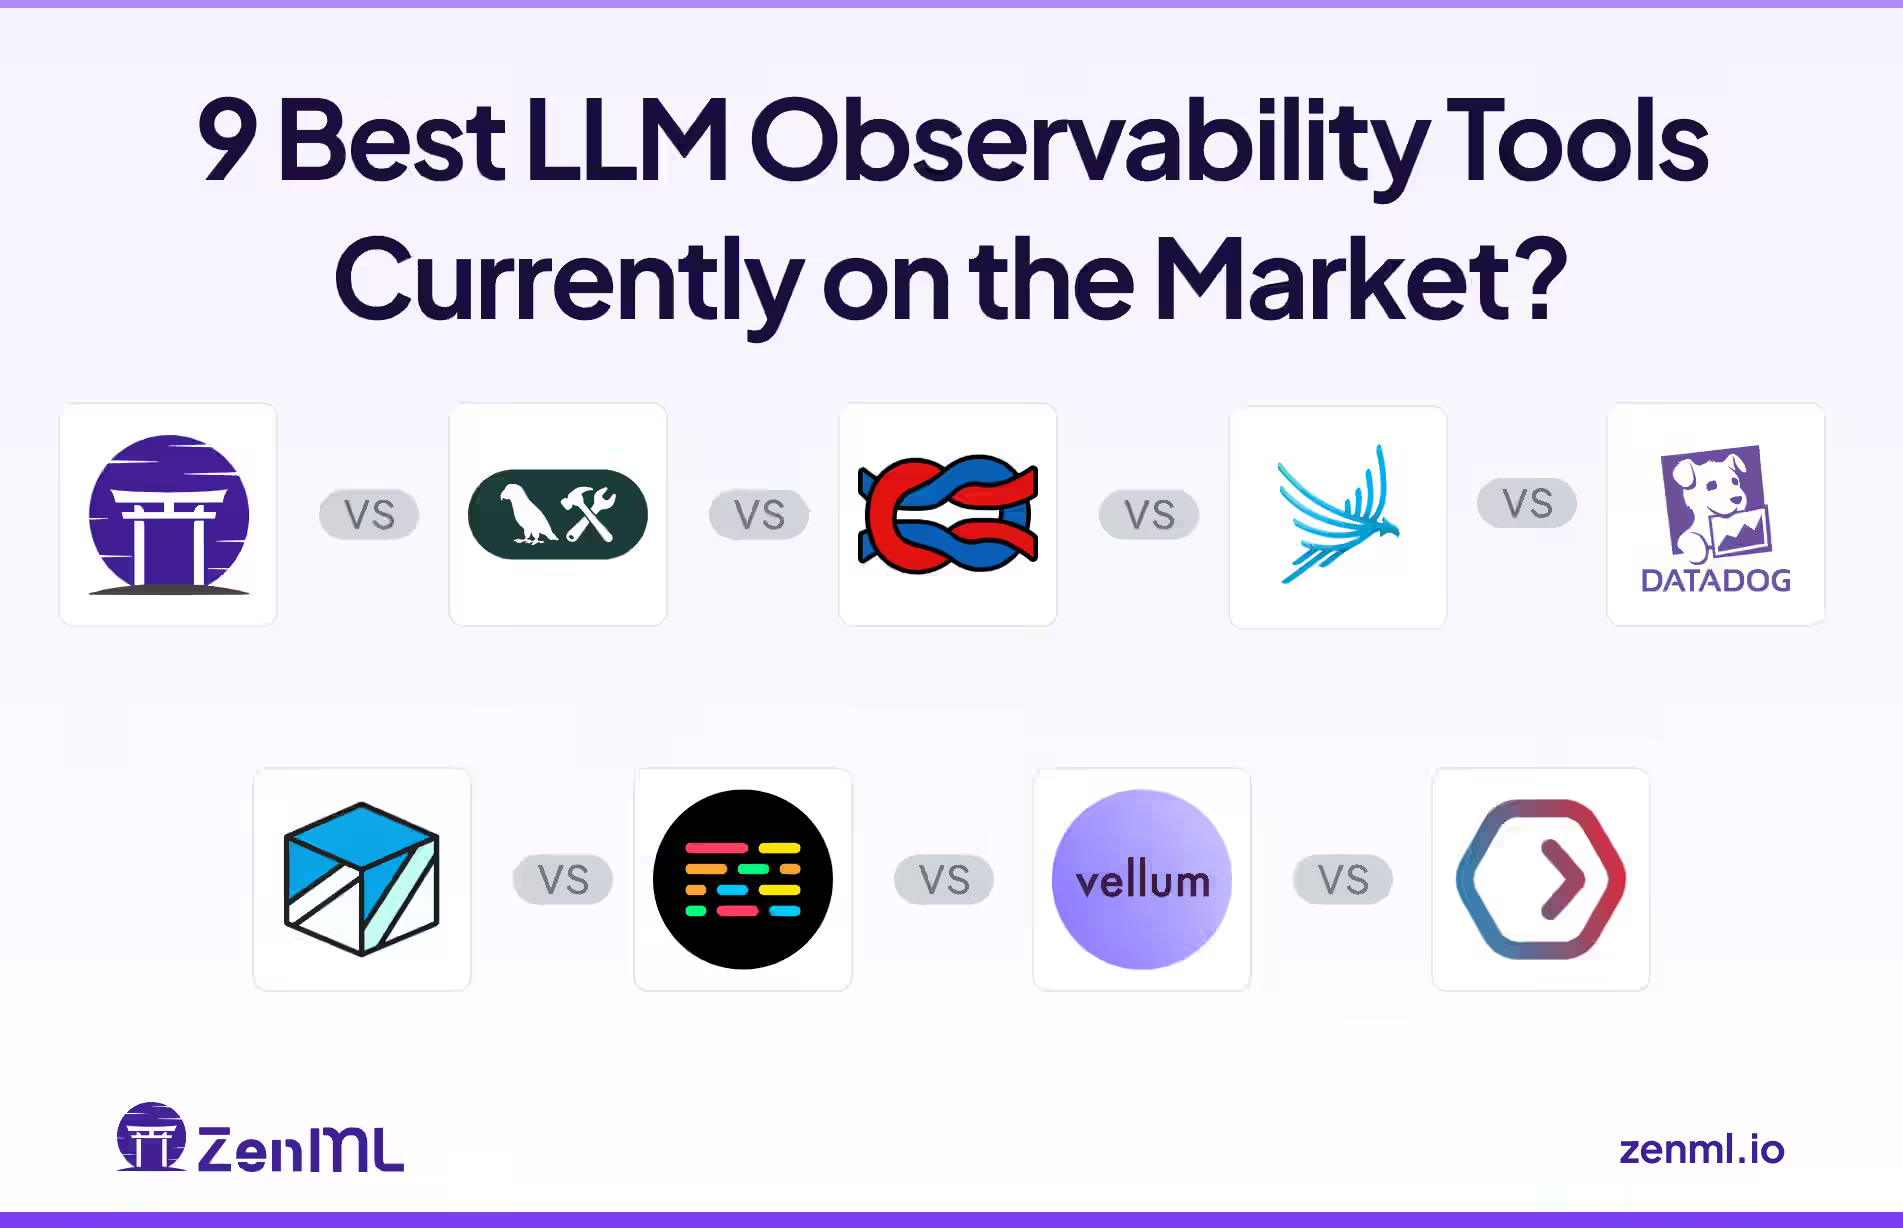
The best LLM observability tools currently on the market are:
- ZenML: Pipeline-centric platform unifying MLOps and LLMOps with observability
- LangSmith: Purpose-built debugging and monitoring for LangChain applications
- Langfuse: Open-source tracing and analytics with collaborative debugging features
- Arize Phoenix: Notebook-first observability with embedded visualizations
- Datadog LLM Observability: Enterprise APM extended for LLM workloads
- Helicone: Proxy-based monitoring with minimal code changes
- Traceloop OpenLLMetry: OpenTelemetry-native instrumentation for LLMs
- Vellum: Deployment platform with integrated observability workflows
- Portkey: AI gateway with built-in observability and reliability features
What to Look for In an LLM Observability Tool?
The right observability tool transforms your isolated AI systems into transparent, debuggable pipelines. And for that, here are some key features you must look for:
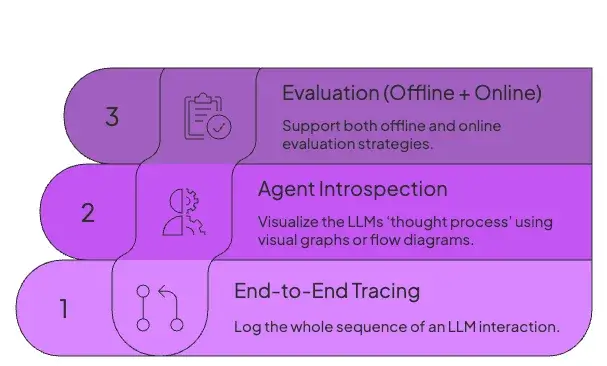
1. End-to-End Tracing
Look for tools that log the whole sequence of an LLM interaction: the initial prompt, calls for RAG, external tool calls, memory updates, and the final output.
In case a run fails, it should help you replay the run with the exact same inputs and configurations. The end-to-end tracking allows you to reproduce the error and find its source.
Additionally, look for tools that can correlate related events with unique identifiers, like run_id, session_id, and user_id, to help you trace a single session across multiple steps or microservices.
2. Agent Introspection
Find tools that help you visualize the LLMs ‘thought process’ using visual graphs or flow diagrams. The visualization makes it easy to inspect traces and helps in debugging.
Notably, the visuals should also highlight the agent’s state at each step. For example, the first thought or plan, any retrieved context, and the results returned by tools. Learning about the agent’s state at each step helps in understanding why it made a certain move.
3. Evaluation (Offline + Online)
Observability is incomplete without evaluation. Look for tools that support both offline and online evaluation strategies.
- Offline evaluation involves running tests on versioned datasets to validate changes to prompts, models, or tools before deployment, acting as a form of regression testing for LLMs.
- Online evaluation uses techniques like LLM-as-a-judge for automated scoring or by collecting direct user feedback.
What are the Best LLM Observability Tools for Your AI Agents?
In this section, we go all-in with our detailed breakdown of the best LLM observability tools. But before that, here’s a quick summary:
| Tool | Best for | Key features | Pricing |
|---|---|---|---|
| ZenML | Teams needing pipeline-centric MLOps + LLMOps | DAGs, run history, artifact lineage, step logs, experiment tracking | OSS free Pro managed (custom) |
| LangSmith | LangChain devs who need deep tracing and evals | End-to-end traces, LLM-as-judge, Prompt Playground, dashboards | Free Plus $39/user/mo Enterprise custom |
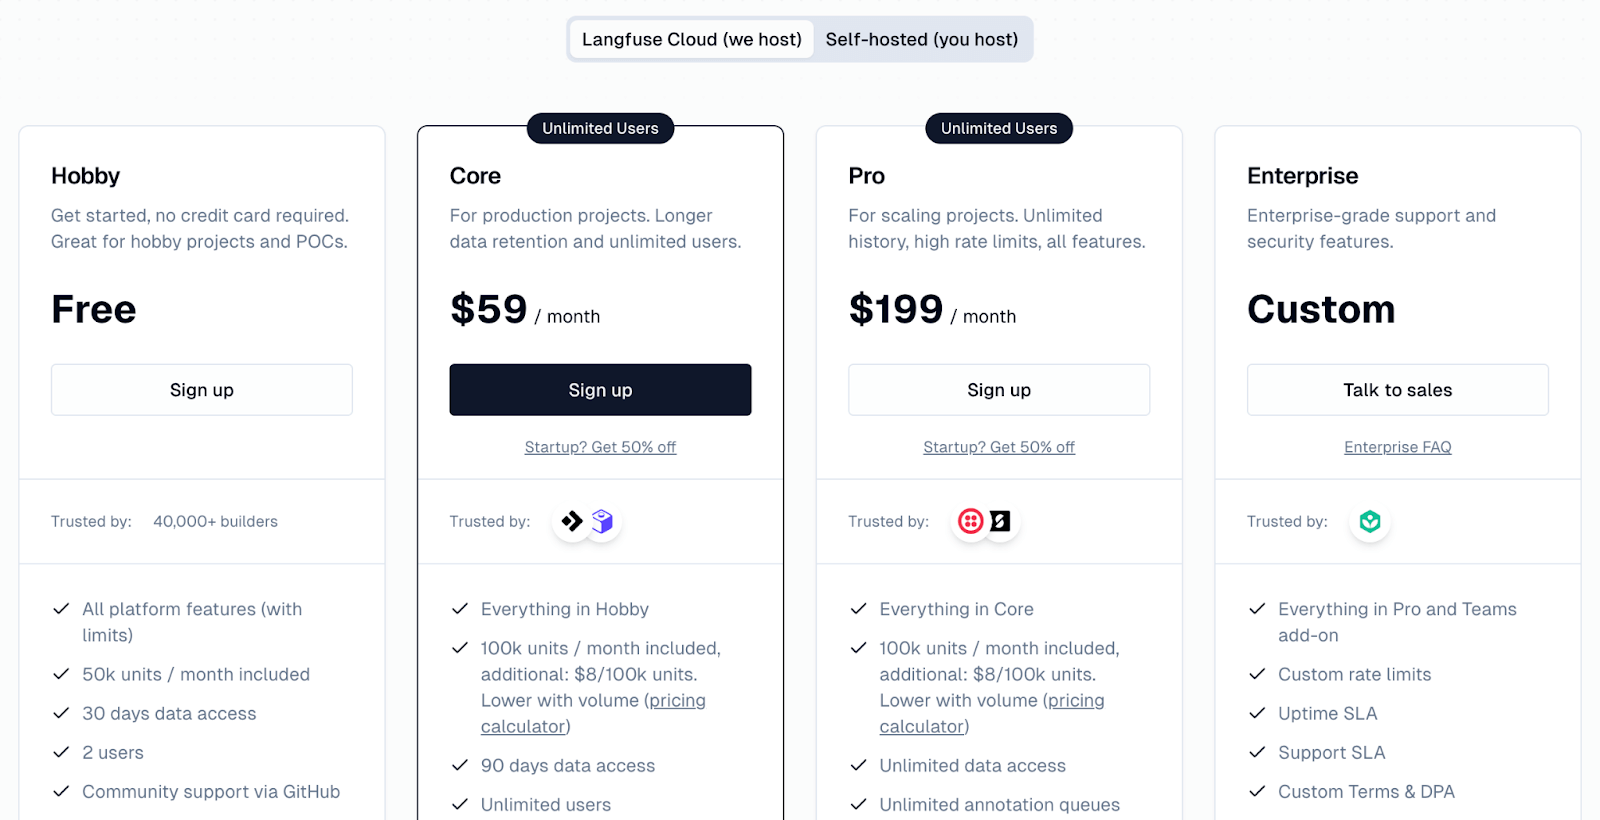
| Langfuse | Open-source tracing with cost analytics | Tree/graph traces, prompt mgmt, session replay, cost tracking | Free Hobby Core $59/mo Pro $199/mo Enterprise custom |
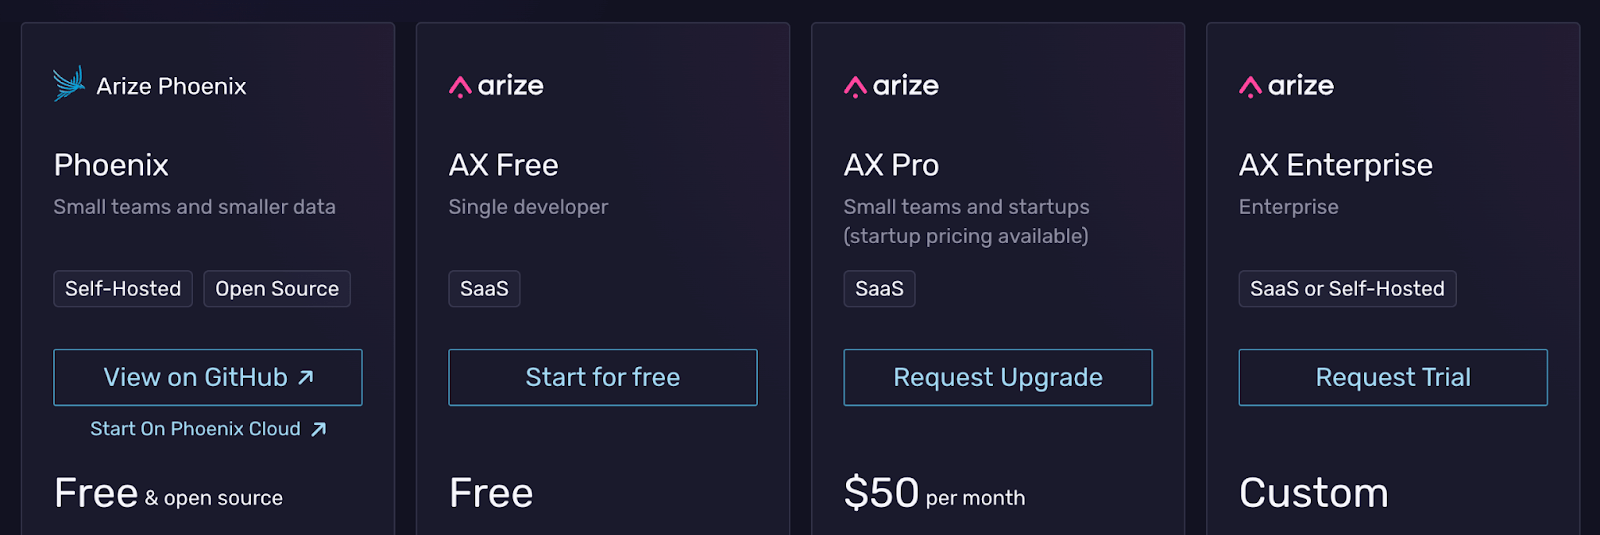
| Arize Phoenix | Local/debug-first RAG apps | Notebook UI, OTel support, RAG evals, clustering | Free OSS AX Pro $50/mo Enterprise custom |
| Datadog LLM Obs. | Enterprises already on Datadog | Correlates LLM + infra, dashboards, safety checks | Usage-based; contact sales |
| Helicone | Startups needing quick proxy-based logs | Proxy logs, dashboards, caching, sessions, metadata | Free tier Pro $20/seat/mo Team $200/mo Enterprise custom |
| Traceloop OpenLLMetry | Teams standardizing on OpenTelemetry | OTel SDK, auto-instrumentation, vendor-agnostic | Free (50k spans/mo) Enterprise custom |
| Vellum | All-in-one Build → Eval → Deploy | Visual traces, A/B tests, rollback, monitoring | Startup / Pro / Enterprise (custom quote) |
| Portkey | Teams needing AI gateway + observability | API gateway, 40+ trace details, cost controls, OTel export | Free Production $49/mo Enterprise custom |
1. ZenML
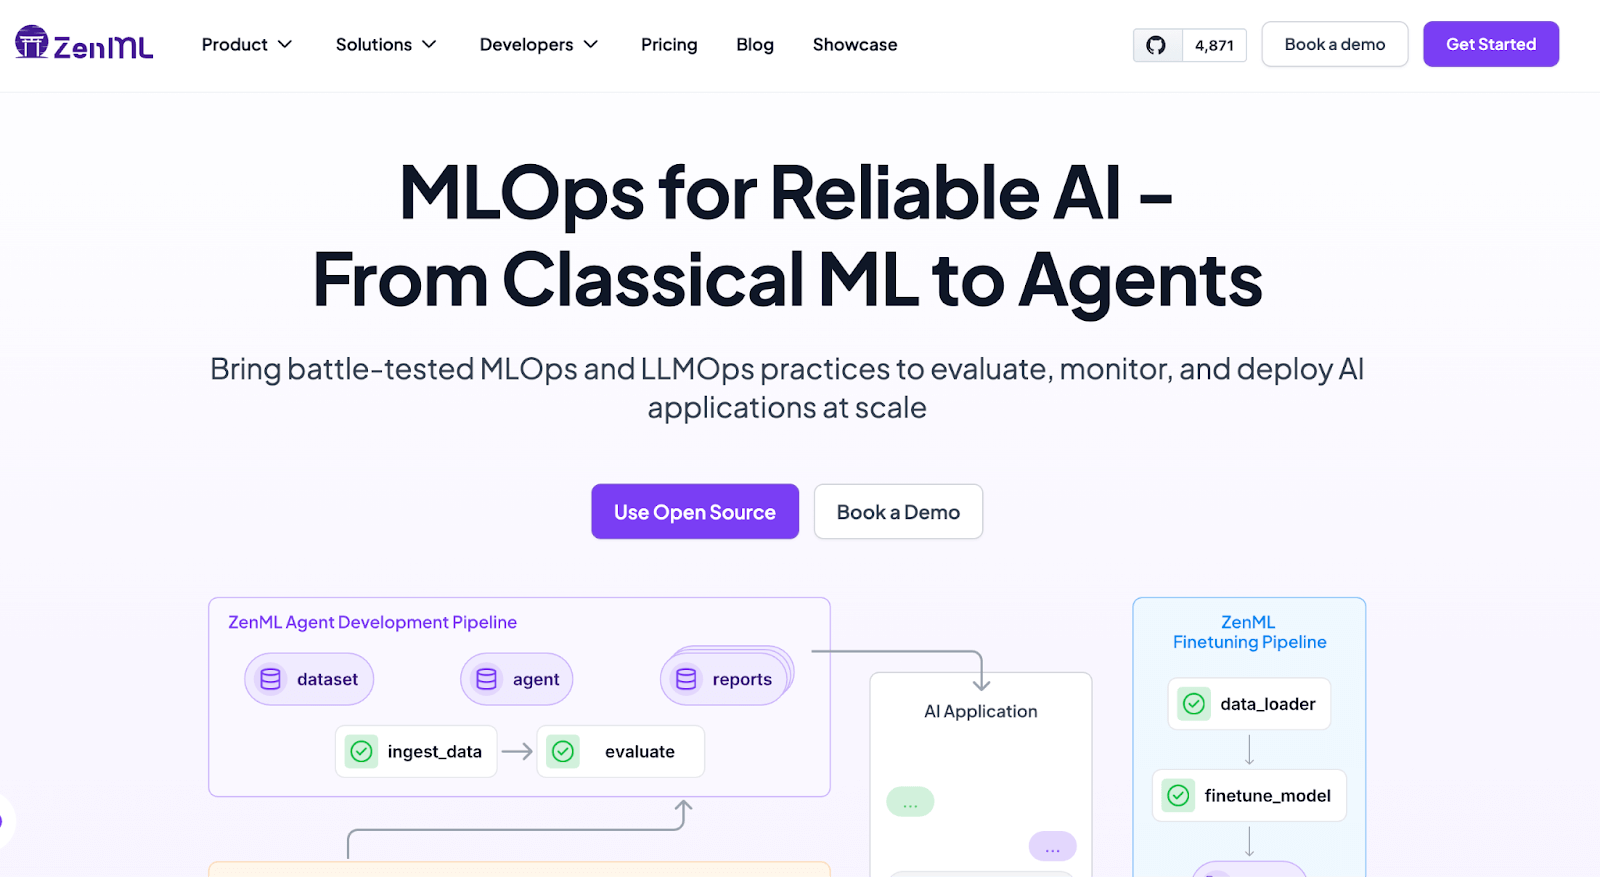
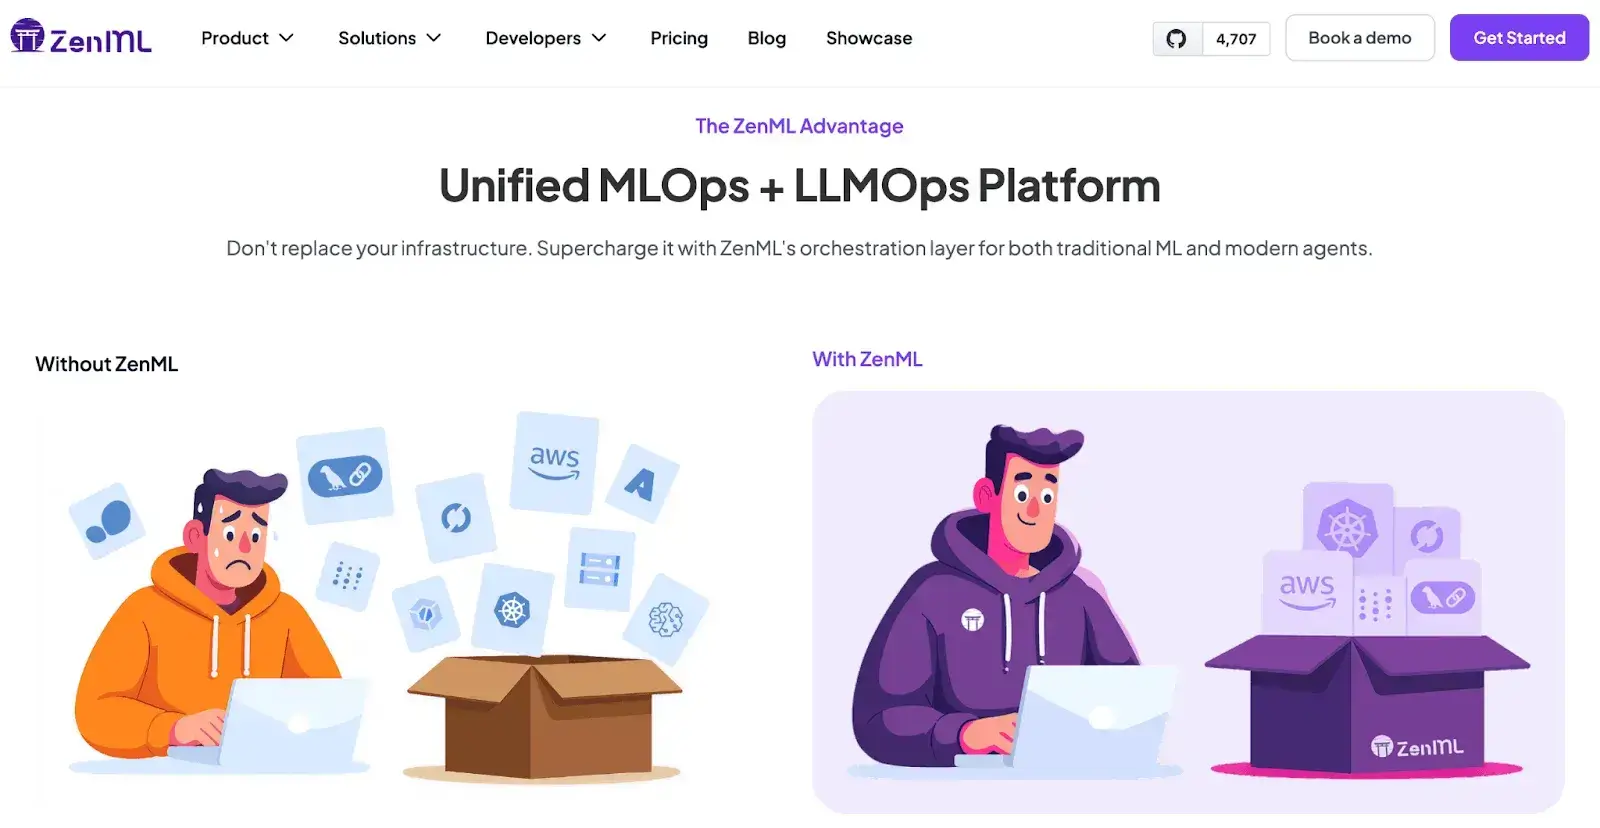
ZenML is a pipeline-centric MLOps/LLMOps framework that brings built-in observability to every run, step, and artifact in your AI workflows. It’s listed first in the attached roundup for unifying orchestration and observability.
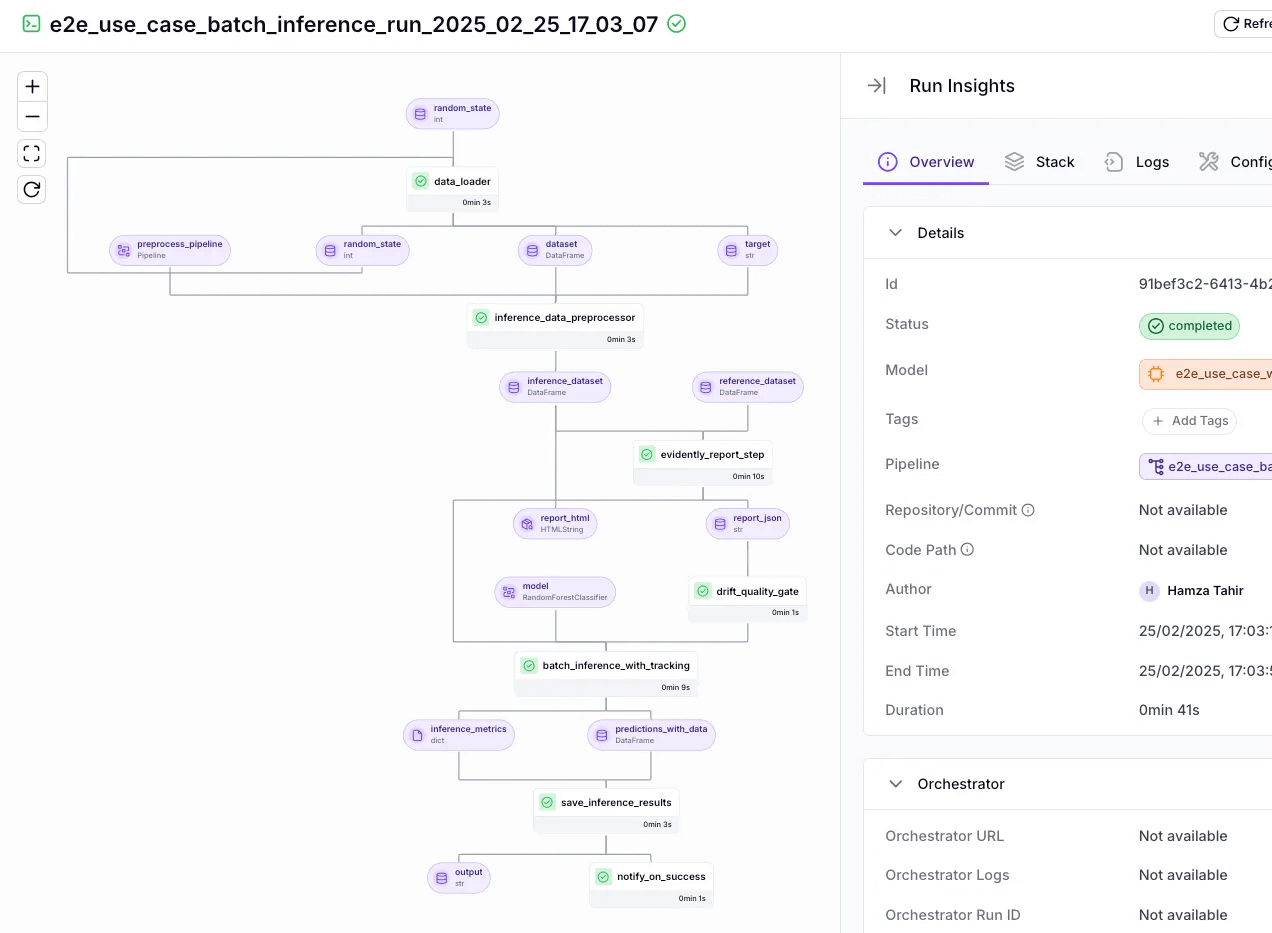
Its dashboard gives you an interactive DAG, run history, artifact lineage, step logs, and runtime metrics, plus Pro-only model/experiment views.
Features
- End-to-end run tracing in the dashboard: Inspect pipelines as DAGs, browse run history, compare configurations, and drill into step-level metrics and outputs to spot failures fast.
- Centralized log capture: Automatically record pipeline-run logs and step logs, store them in your artifact store, and surface them in the dashboard; verbosity/format are configurable.
- Experiment tracking and autologging: Plug in MLflow, W&B, or Comet as experiment-tracker components; use MLflow autologging inside steps. ZenML Pro adds experiment comparison tools in the UI.
- Versioned context for every run: Code-repo integration pins the exact git commit per pipeline run; configuration can be captured via YAML; artifacts are tracked and versioned with lineage.
- Compliance-ready audit trails: Automatic artifact lineage across every pipeline step plus centralized logs and params, Git-linked code versions, and captured pipeline/step configuration create exportable, audit-friendly run records for regulated use cases.
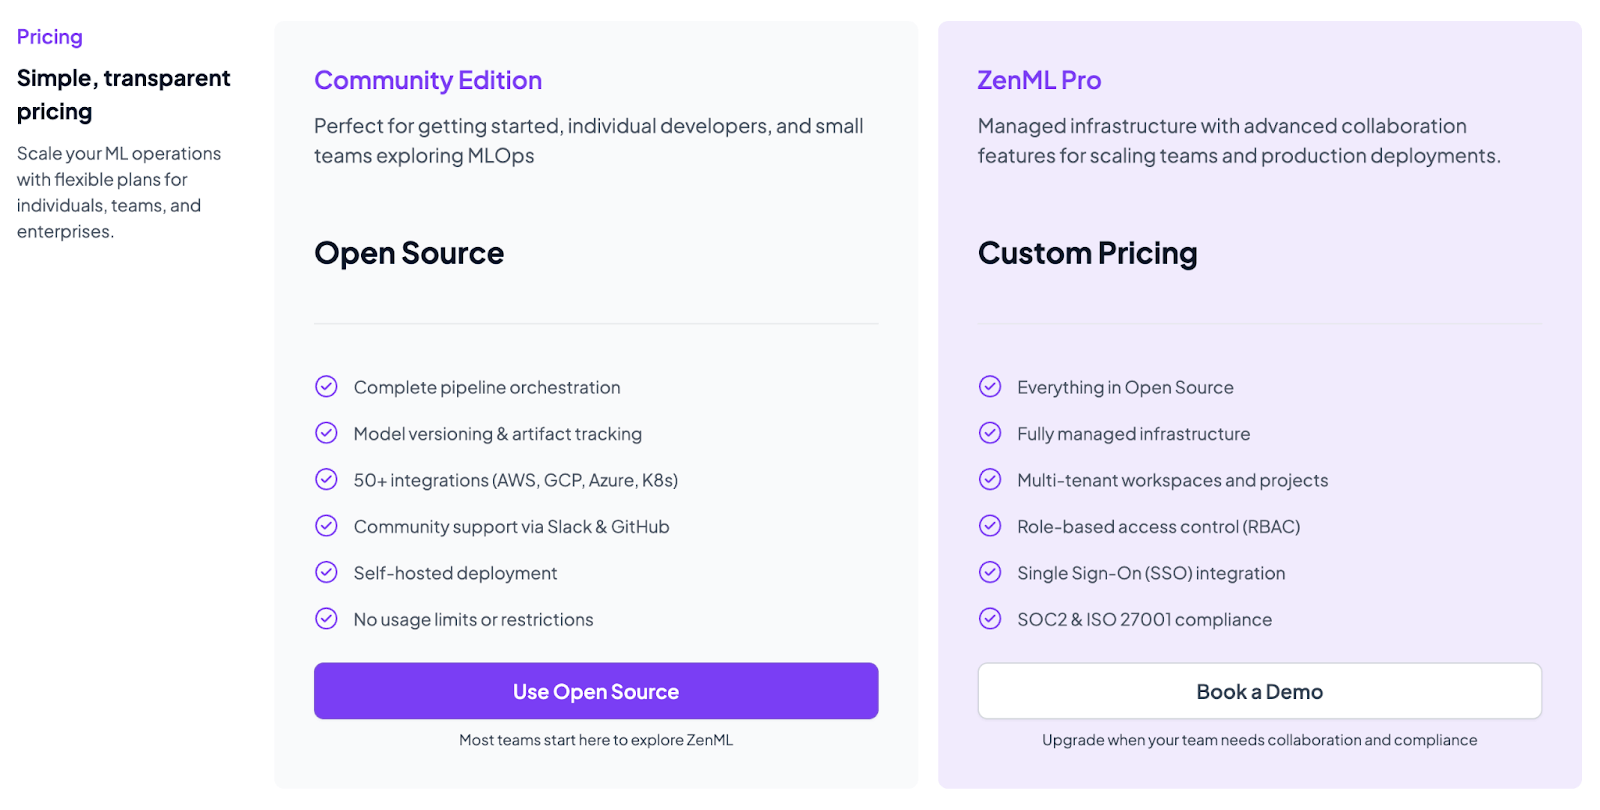
Pricing
We are upgrading our platform to bring every ML and LLM workflow into one place for you to run, track, and improve. Think of processes like data preparation, training, RAG indexing, agent orchestration, and more, all in one place.
Pros and Cons
ZenML offers pipeline-first visibility with an interactive DAG, run history, artifact lineage, and step logs, making debugging simple. It integrates cleanly with experiment trackers and supports autologging.
But remember, ZenML is not a specialized LLM observability or a one-click QA solution – it’s a framework.
2. LangSmith
LangSmith helps teams debug, test, and monitor LLM applications built with the LangChain framework. Although core to LangChain, LangSmith is not limited to LangChain projects and can trace any LLM application.
Features
- Captures detailed, sequential traces of every interaction within an LLM application, including LLM calls, tool inputs and outputs, and intermediate steps within chains and agents.
- Supports both automated evaluations (LLM-as-a-judge) and human-in-the-loop feedback to score each response quality.
- Test prompt variations directly into the ‘Prompt Playground’ where you can experiment with different prompts or models, modify inputs, and compare outputs side-by-side before deploying changes.
- Create live dashboards to track LLM metrics, like cost, latency, response time, and quality. You can set up alerts for when a metric moves from a set threshold.
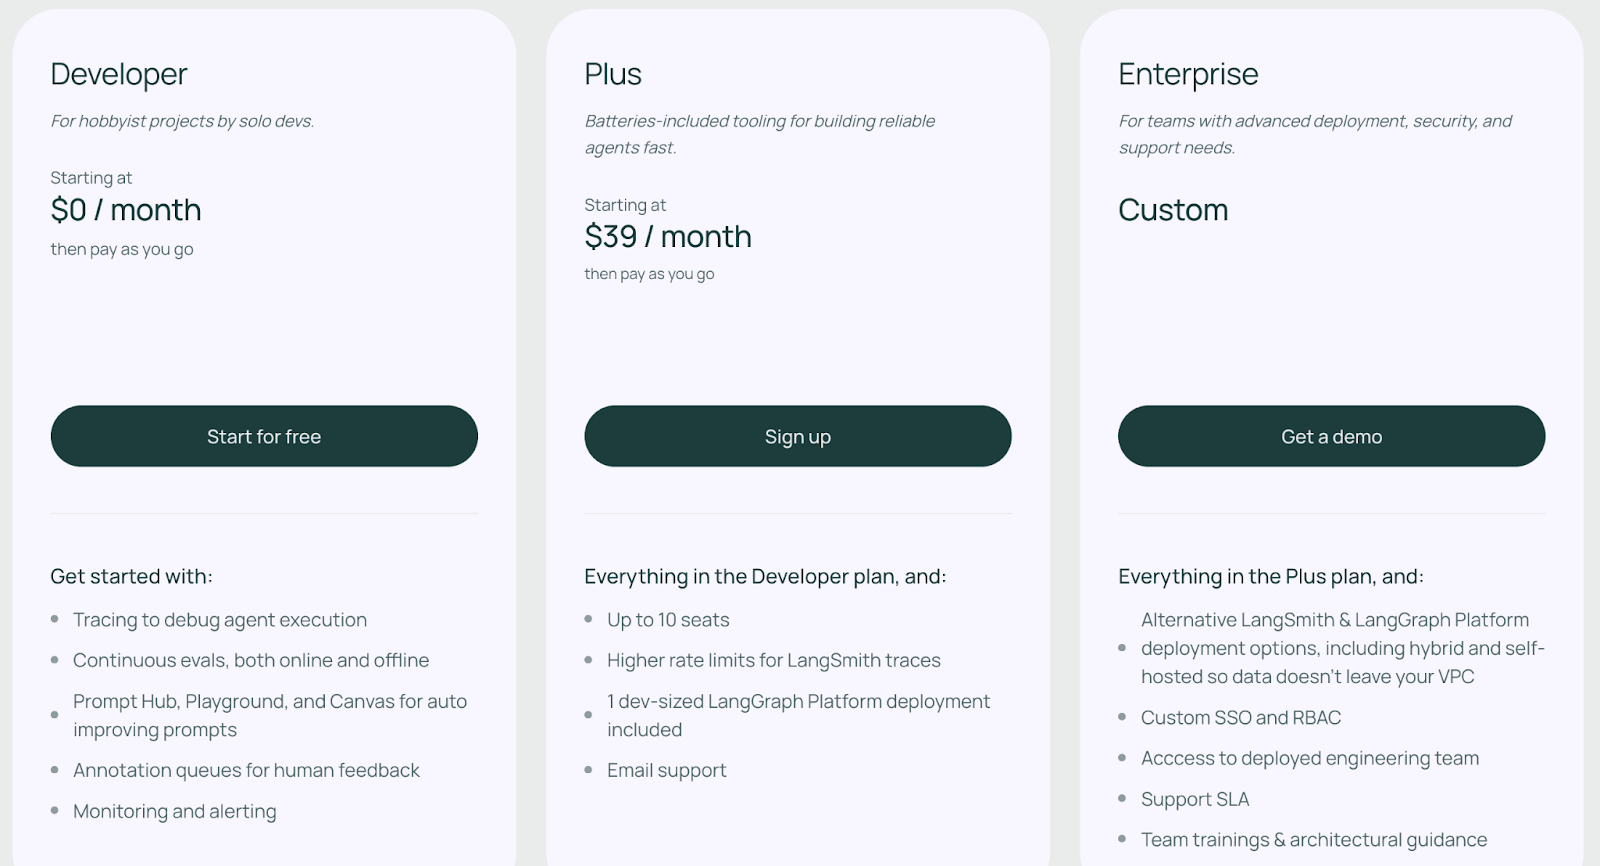
Pricing
You can use LangSmith by signing up for LangChain. It offers a generous free plan for hobbyist projects and three premium plans:
- Plus: $39 per month
- Enterprise: Custom pricing
Pros and Cons
LangSmith’s tight integration with LangChain is a major pro for teams building on LangChain’s ecosystem. The UI is polished for reading chain logs. Its debugging and tracing visualizations are excellent for solving complex agentic logic.
However, since LangSmith’s focus is on the application layer, it doesn’t monitor system metrics or GPU usage. You’d still rely on traditional APM tools, like Datadog, for lower-level metrics.
3. LangFuse
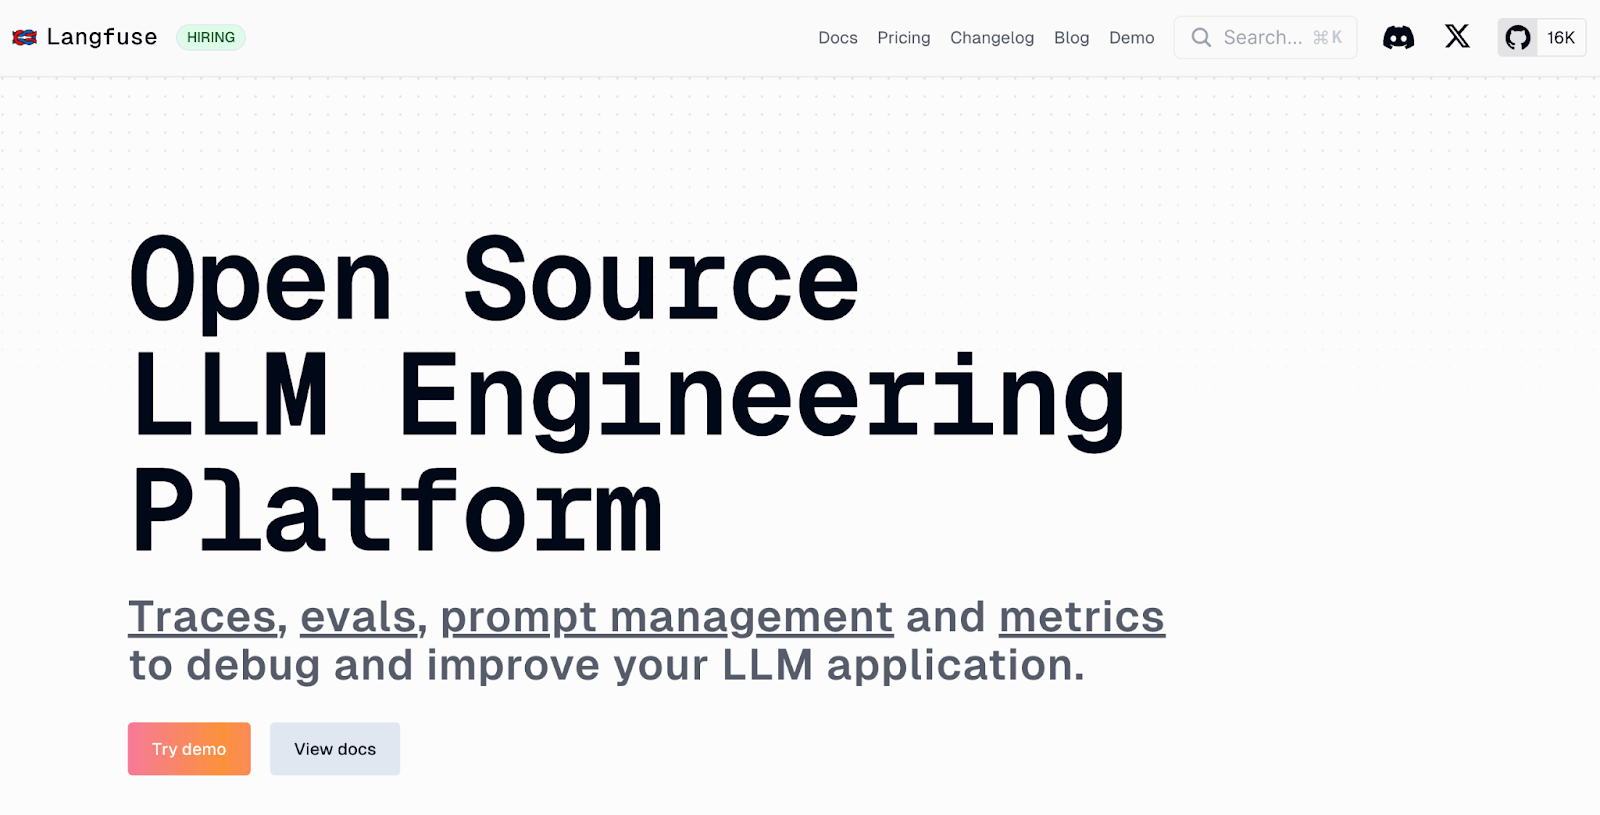
Langfuse is an open-source LLM observability platform designed with collaborative debugging and cost tracking in mind. It provides detailed tracing, prompt management, and evaluation capabilities while remaining framework-agnostic.
Features
- Offers a visual UI for log tracing. You can see a tree-shaped flow of each LLM call with nested calls, like vector DB lookups or function calls the LLM made. Every span is timestamped, plus you can filter or search across all traces.
- Share trace URLs with team members, add comments to specific spans, and track issues through resolution. Session replay shows the full conversation context for easy debugging of multi-turn interactions.
- Separate prompt logic from application code with a version-controlled prompt management system.
- Built-in cost analytics dashboard lets you monitor token usage and costs across models, track expensive prompts, set budgets, and receive real-time alerts for cost overruns.
Pricing
Langfuse offers a generous free ‘Hobby’ plan on its cloud platform and has three paid plans:
- Core: $59 per month
- Pro: $199 per month
- Enterprise: Custom
Pros and Cons
Langfuse’s strengths are its open-source nature and a good balance between simplicity and features. Unlike competitors, it has a strong focus on product analytics, like user and session tracking. Built-in collaborative features make it particularly strong for teams debugging issues together.
While Langfuse’s UI is solid, it’s not as tightly integrated into development workflows as a proprietary option like LangSmith. Additionally, because it tries to do a lot, initial setup and schema planning might require thought.
4. Arize Phoenix
Arize Phoenix is an open-source LLM observability tool built by Arize AI, known for its ML model monitoring platform. It is built entirely on OpenTelemetry standards and is designed to run in your local environment, such as a Jupyter notebook or a container.
Features
- Supports local-first debugging, which allows you to trace and debug LLM applications directly on your machine or within a private VPC.
- Works with LangChain, LlamaIndex, and OpenInference conventions on top of OpenTelemetry, so traces can flow to Phoenix or another OTel-compatible backend.
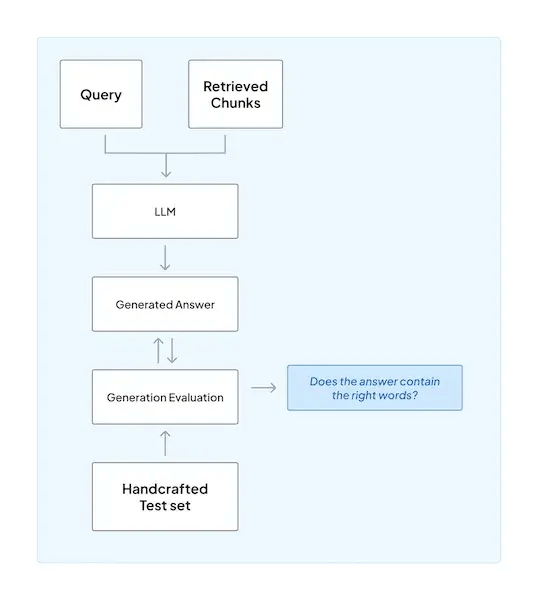
- Run offline and online evaluations using LLM-as-a-judge or custom judges to compare versions of prompts, models, or toolchains and score them based on relevance and quality.
- Analyze retrieval relevance with built-in metrics, visualize document chunk distributions, and identify gaps in knowledge bases through query analysis for RAG-specific debugging.
- Add performance tracing heatmaps, explainability, model drift detection, cluster search, and human annotation to improve models for production.
Pricing
Phoenix is open source and free to self-host. Arize also offers hosted options for managed deployment and enterprise needs.
- AX Pro: $50 per month
- AX Enterprise: Custom pricing
Pros and Cons
Phoenix’s notebook-native visualizations are powerful for debugging RAG applications. It’s free, runs locally, and makes a good LLM observability tool for developers who seek full control over their data.
On the con side, Phoenix can be a bit heavyweight: it’s essentially a full application with a GUI, and it might be overkill if you just need simple logging. The UI, while powerful, has a learning curve. It’s geared towards power users who want to dig into distributions, apply filters, etc. If you just want to quickly see a log of the last 100 prompts and nothing more, Phoenix might feel complex.
5. Datadog LLM Observability
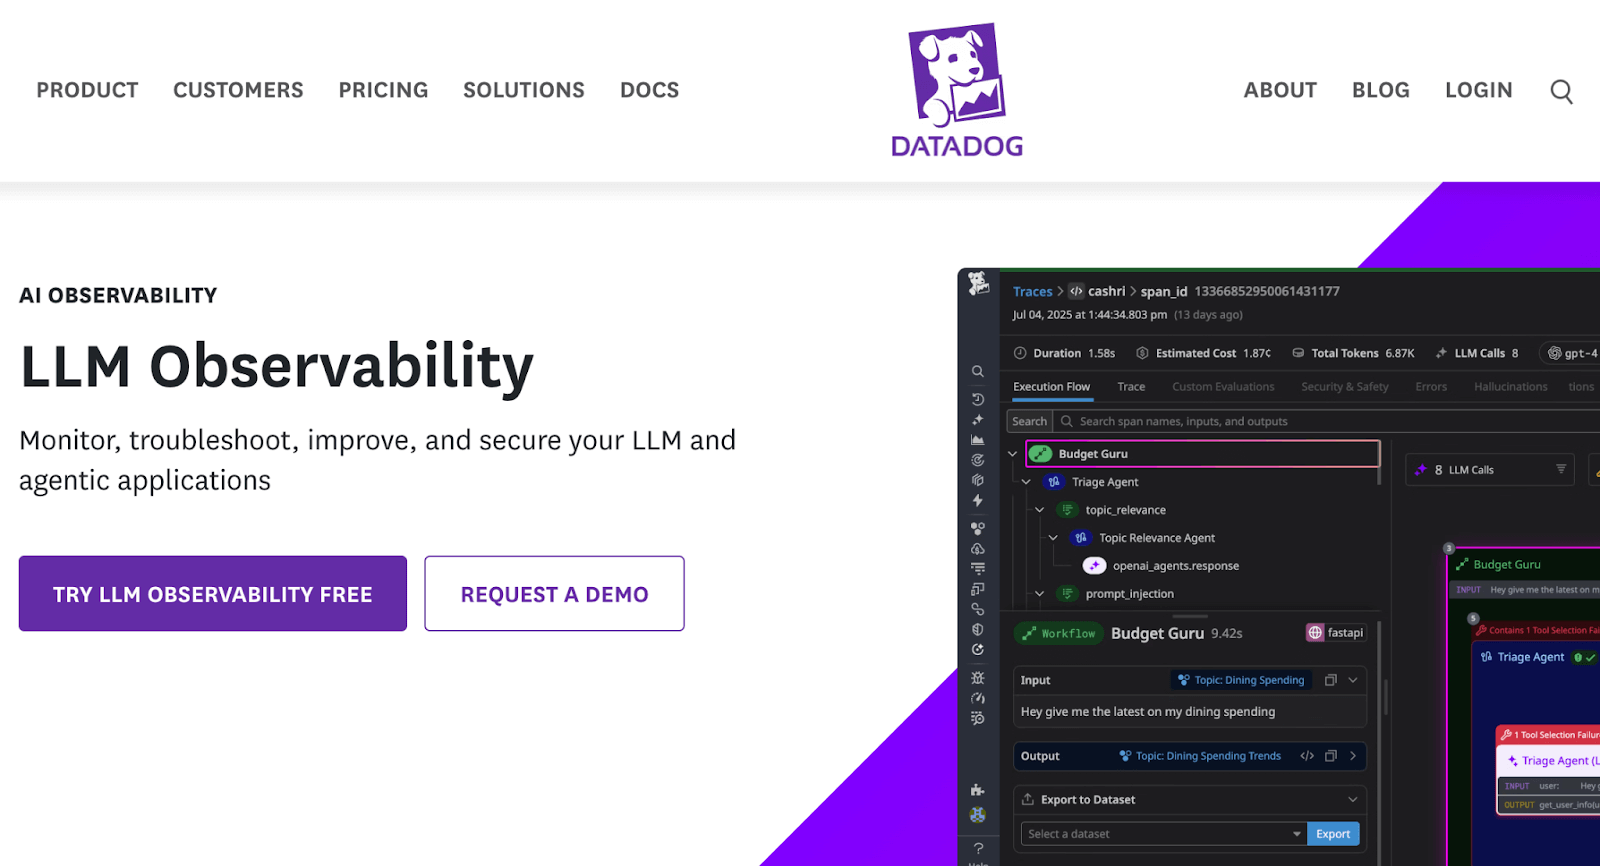
Datadog extends its enterprise APM platform with dedicated LLM observability features. If your organization already uses Datadog for infrastructure or microservice monitoring, this is a natural way to bring LLM events into that fold.
Features
- Integrated APM lets you correlate LLM latency with infrastructure metrics, trace requests from frontend to backend and LLM calls, and identify whether issues originate from models or application code.
- Redact sensitive data using custom rules or with the built-in Sensitive Data Scanner library, alongside custom evaluators for quality metrics, and automated alerting for safety violations.
- Group similar prompts and responses on the Cluster Map to compare performance by topic and surface slow or error-prone themes
- Use prebuilt ‘LLM Overview’ and operational dashboards to track request counts, error rates, token consumption, and model latency; wire alerts to your existing Datadog monitors.
Pros and Cons
If you’re already using Datadog, its LLM observability becomes a natural extension. It eliminates the need for separate tools, plus correlates LLM behavior with underlying system performance. This means, for instance, you can compare an LLM’s high latency with a spike in CPU on the host, all in Datadog.
However, for teams not already using Datadog, adopting it just for LLM observability might be overkill. There’s also less focus on qualitative evaluation. Datadog provides basic quality checks and clustering, but lacks in-depth prompt management or a side-by-side LLM evaluation interface like LangSmith or Phoenix.
Pricing
Datadog’s LLM Observability is not a separate product, but rather an add-on capability within the Datadog platform. Pricing is subject to usage, and you must contact their sales team to get a quote.
6. Helicone
Helicone is a lightweight proxy-based LLM observability tool. Instead of calling the LLM API directly, you can route requests through Helicone’s proxy endpoint, and it will log all requests and responses along with response time, analytics, and metadata, without requiring an SDK or code modification.
Features
- Log prompts, model outputs, response times, and more with out-of-the-box support for OpenAI, Anthropic, Azure OpenAI, and other OpenAI-compatible endpoints, plus integrations for LangChain and libraries like LiteLLM.
- Use highly-visual dashboards to view LLM usage metrics, like the prompt, the model’s response, timestamps, which user, and customer parameters of your choice.
- Reduce costs with intelligent response caching, custom rate limits, and switching between multiple models for savings in real-time.
- You can add custom metadata to requests, such as a
user-idorsession-id, by passing them as headers. The metadata helps you group requests on a per-user or per-session basis.
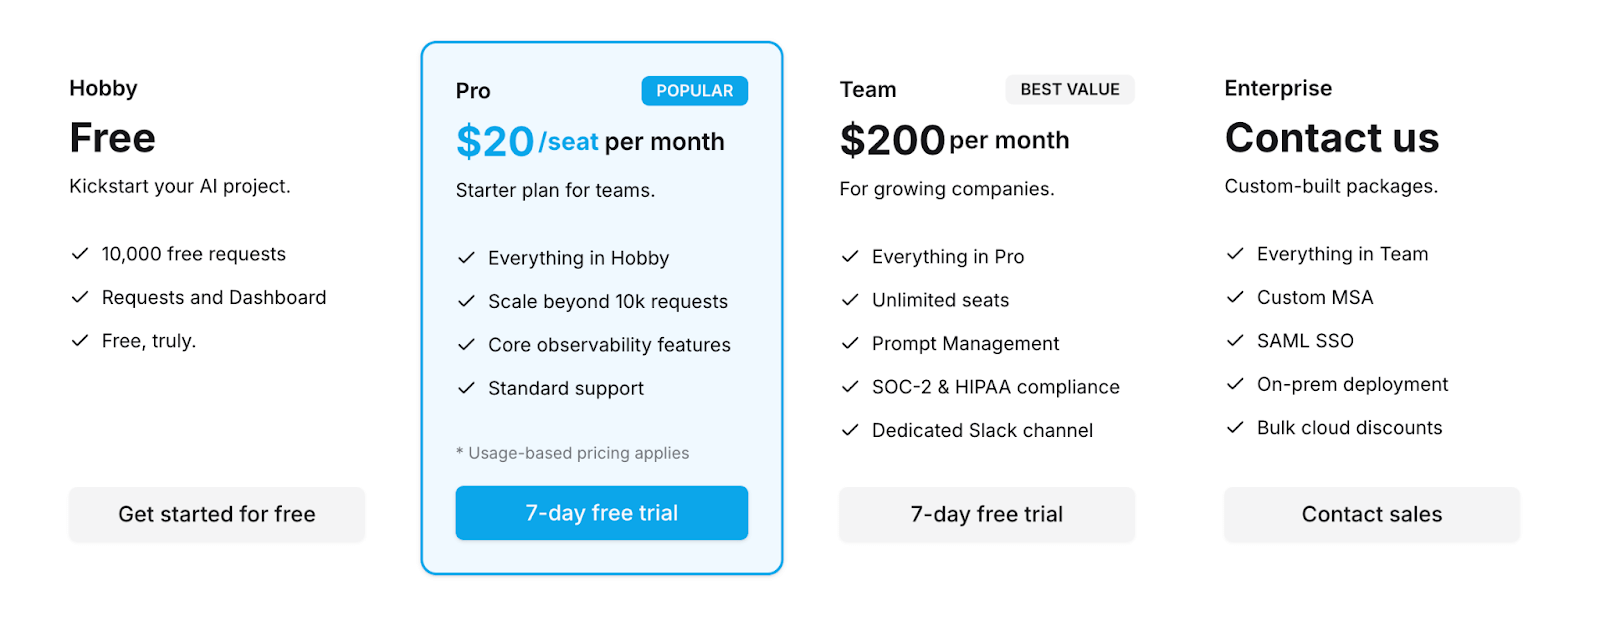
Pricing
Helicone has a free plan for hobbyists and three premium plans:
- Pro: $20 per seat per month
- Team: $200 per month
- Enterprise: Custom pricing
Pros and Cons
Helicone’s core strength is its simplicity and ease of integration. The caching layer significantly reduces costs for applications with repeated queries.
However, the proxy-first approach adds a potential point of failure and latency to your LLM calls. Features like distributed tracing or custom instrumentation are limited compared to SDK-based solutions.
7. Traceloop OpenLLMetry
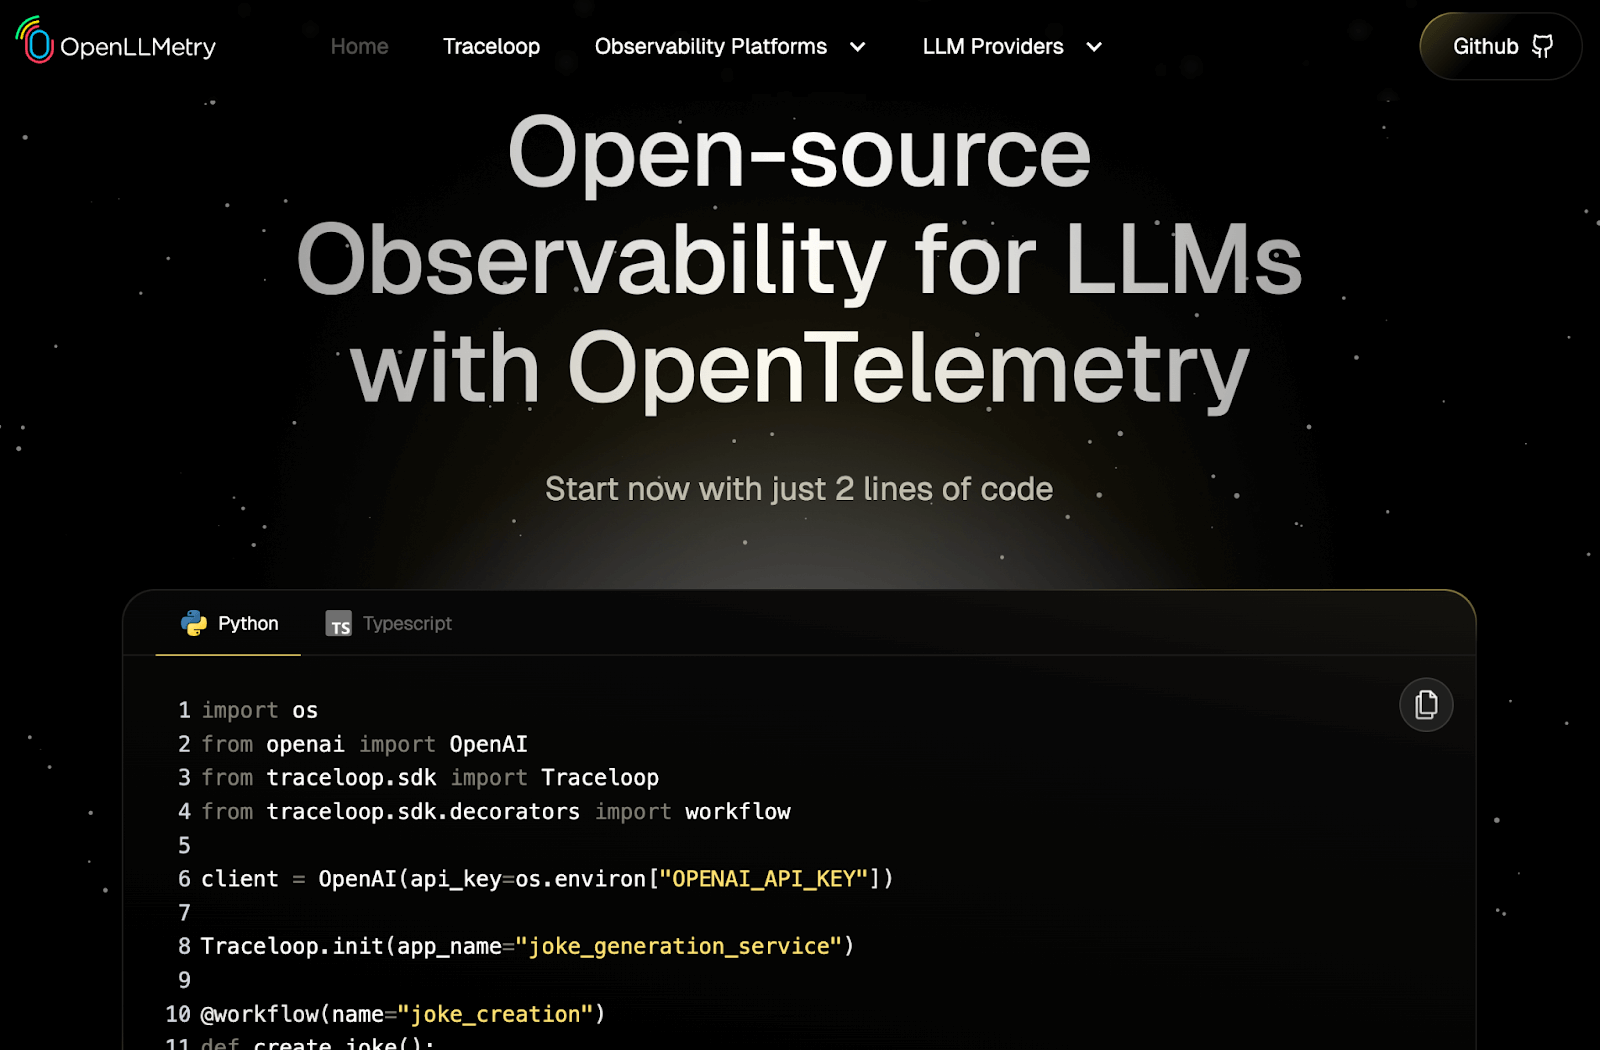
OpenLLMetry by Traceloop is an open-source SDK and standard for sourcing LLM observability data via OpenTelemetry. It allows developers to configure their code using a standard OTPL protocol and send traces to the Traceloop platform or any other OpenTelemetry-compatible backend.
Features
- Supports vendor-agnosticism and allows integrating LLM traces into your existing observability tools like Datadog, Honeycomb, Grafana, among others.
- Automates instrumentation for popular LLM frameworks like LangChain and LlamaIndex, as well as for direct calls to foundation model APIs like OpenAI and Anthropic.
- Allows filtering sensitive text and data using OTel sampling or processors.
- Traceloop runs a cloud service that is a dedicated LLM observability backend. If you send OpenLLMetry data there, you get a UI tailored to LLM traces, similar to other platforms.
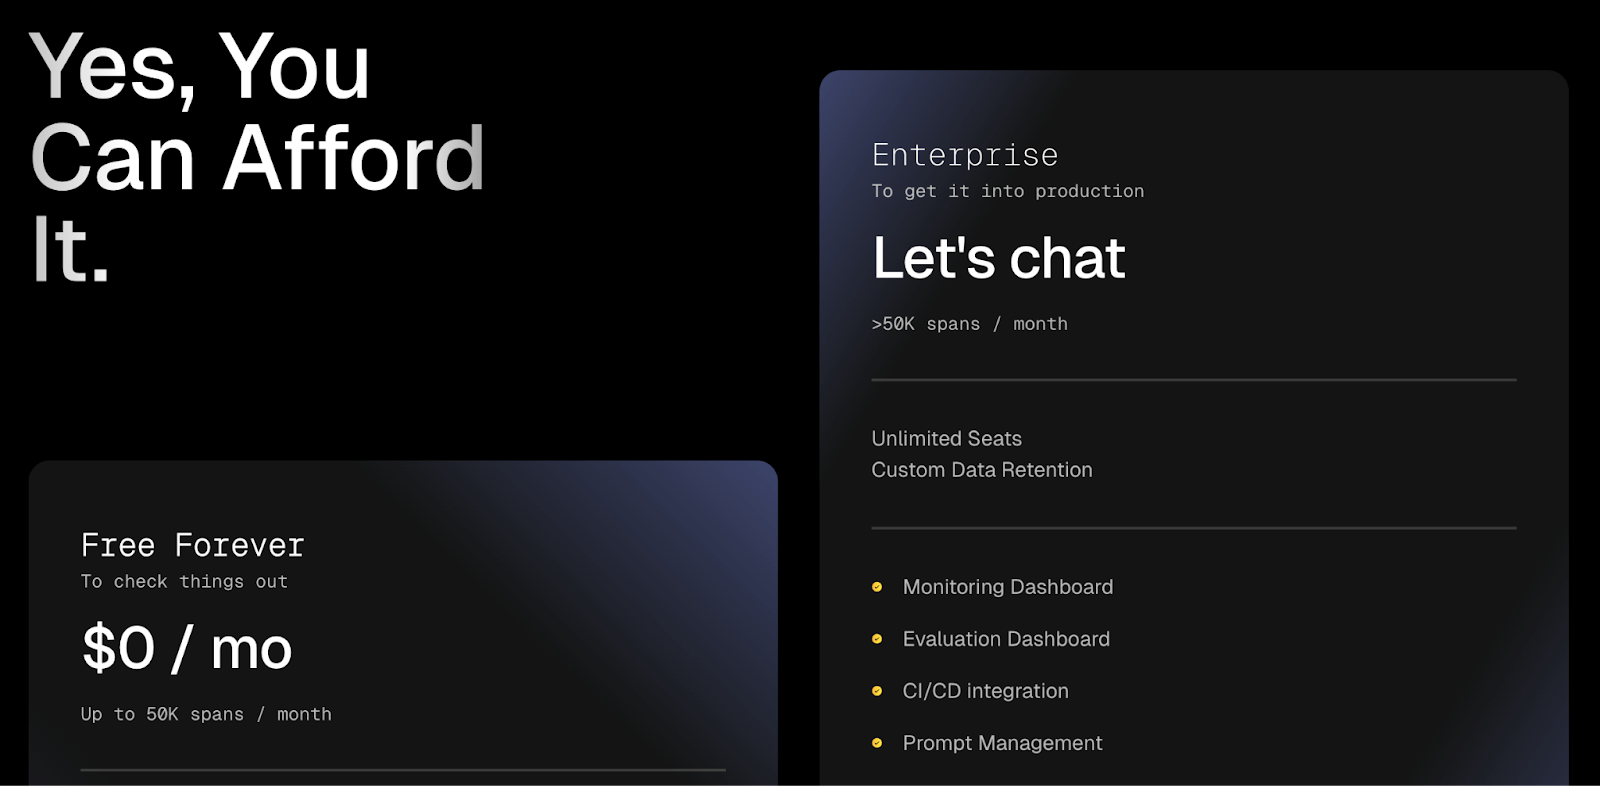
Pricing
OpenLLMetry is completely free. The only costs would be for whatever backend you choose. Traceloop’s own cloud has a free forever plan for up to 50,000 spans per month and a custom enterprise plan.
Pros and Cons
The major pro of OpenLLMetry is flexibility and ownership. It aligns with engineering best practices of using open standards. For teams that are cautious about vendor lock-in, this is very attractive.
The main drawback is that it is an SDK-based solution, requiring more code-level integration compared to proxy-based tools like Helicone. You need to have or choose a backend to actually see the data. If you don’t already have an observability stack, this could mean extra work
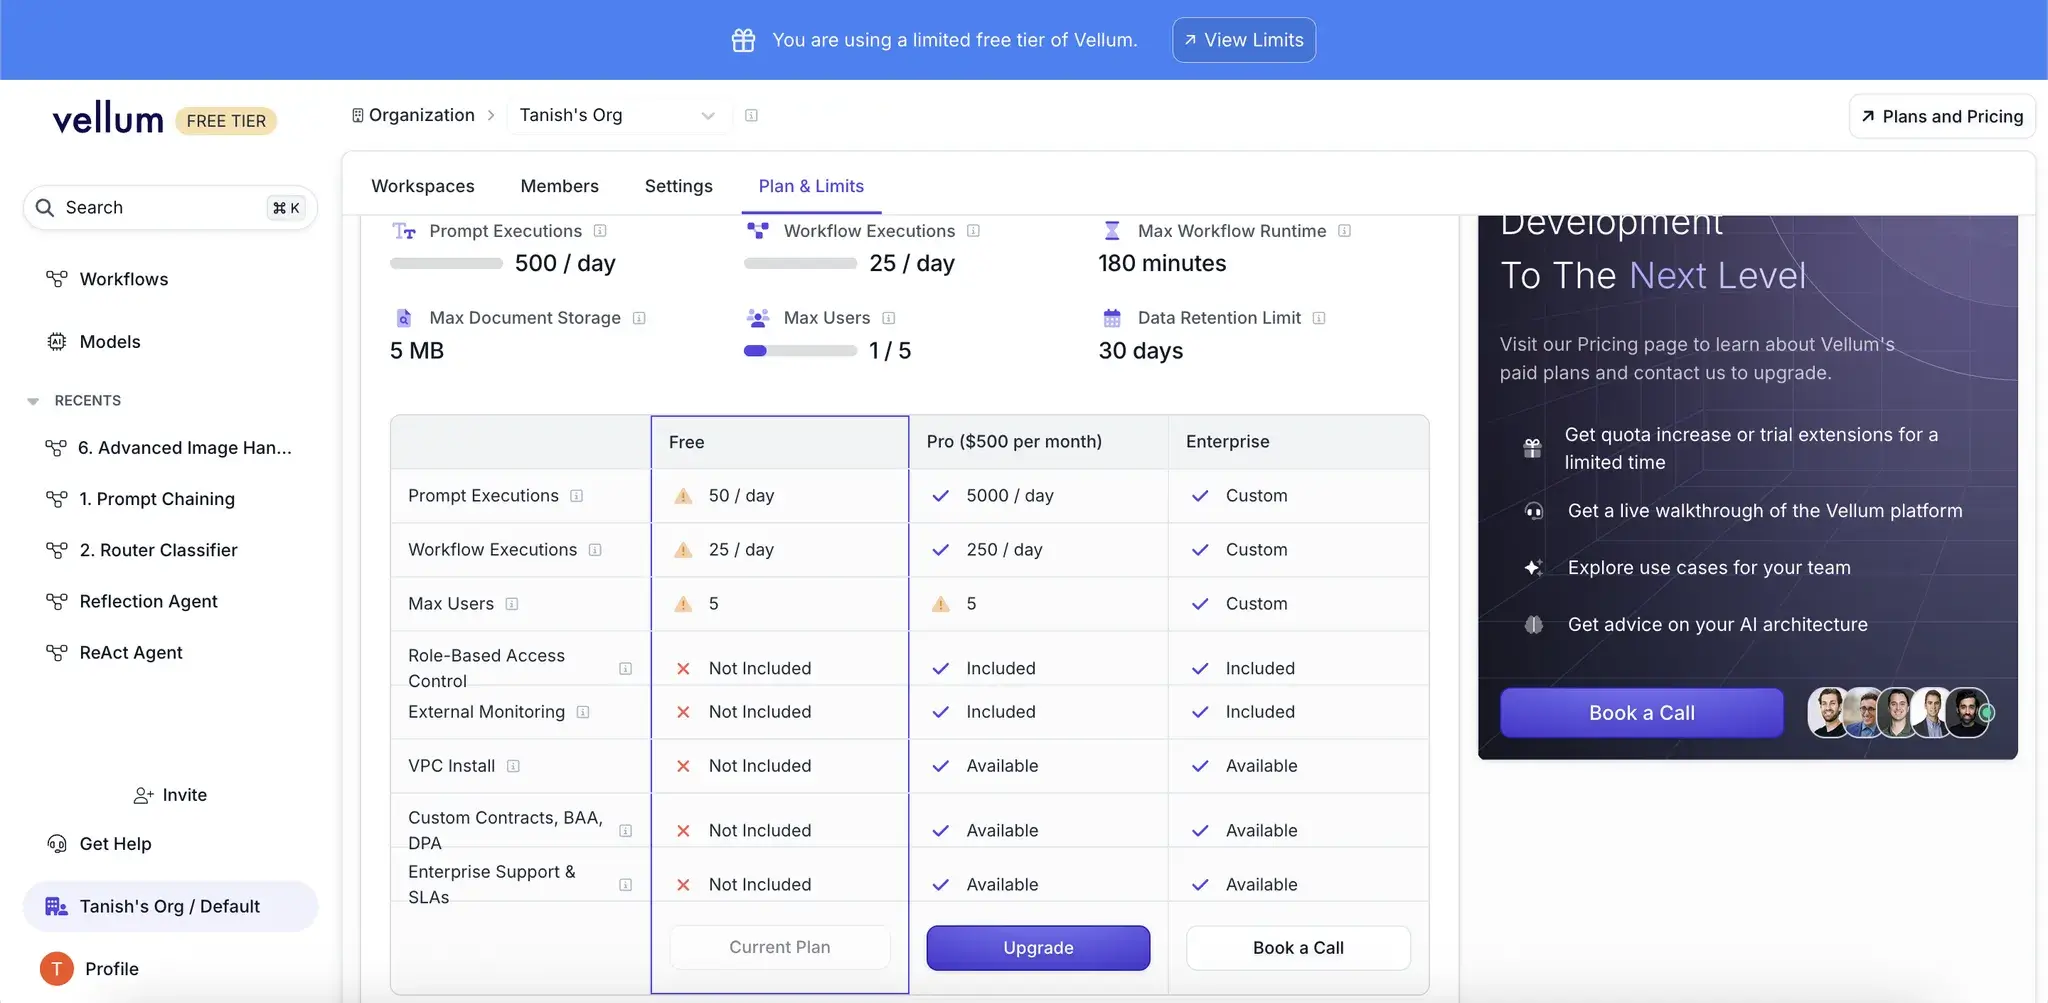
8. Vellum AI
Vellum.ai is a full-stack LLM app-building platform. Core to its stack are observability and monitoring features designed to track the performance of the LLM app built and deployed on the Vellum platform.
Features
- Pinpoint where things go wrong using full-stack traces and visual control flows that show how the AI arrived at an answer with flowchart and timeline nodes.
- Includes tools to capture and measure AI performance through pre-defined criteria, LLM judges, or end-user feedback.
- Run automated A/B tests for deployed prompts and workflows, regression detection, and rollback triggers based on quality metrics.
- Get a bird’s eye view of your AI’s performance with visualizations showing cost, latency, quality, and error rates over time.
Pricing
Vellum offers a free plan with 50 prompt executions per day and lets you collaborate (max 5 users), but if you want premium features and increased limits, it has the Pro plan at $500 per month and the Enterprise plan (custom pricing).
Pros and Cons
Vellum’s strength lies in its all-in-one, integrated approach. For teams seeking a single platform to manage the entire LLM application lifecycle, Vellum offers a very powerful and streamlined solution.
The main con is a higher degree of vendor lock-in. You don’t have the flexibility of open-source or bringing in your own tools.
9. Portkey
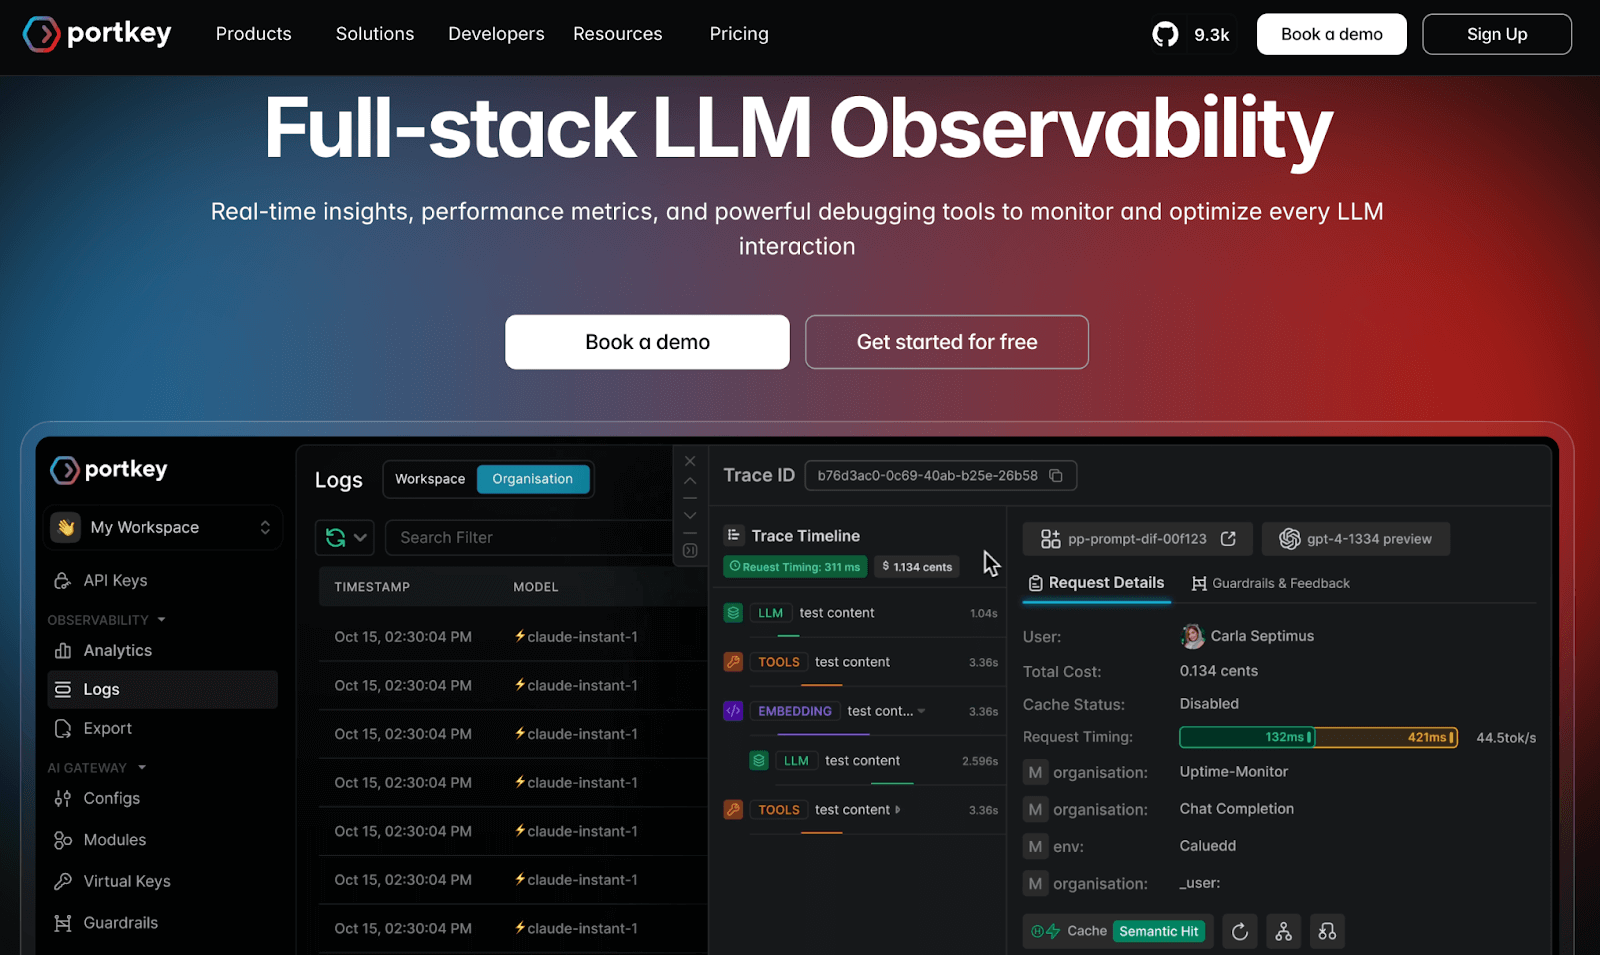
Portkey is an AI gateway and control panel that provides production infrastructure for LLM applications. Think of Portkey as a combination of an LLM API gateway and an observability suite, alongside other enterprise features.
Features
- Auto-instrument tracing, logging, and metrics for multiple LLM frameworks.
- Log every request and response with 40+ details around cost, performance, latency, token count, accuracy, and more.
- Use a unified Trace View to track the entire lifecycle of an LLM request with 15+ filters to drill down on unit cost, token usage, feedback, tracing, and more.
- Built-in cost control tools like real-time budget tracking, overuse alerts, rate limiting per user, and cost allocation.
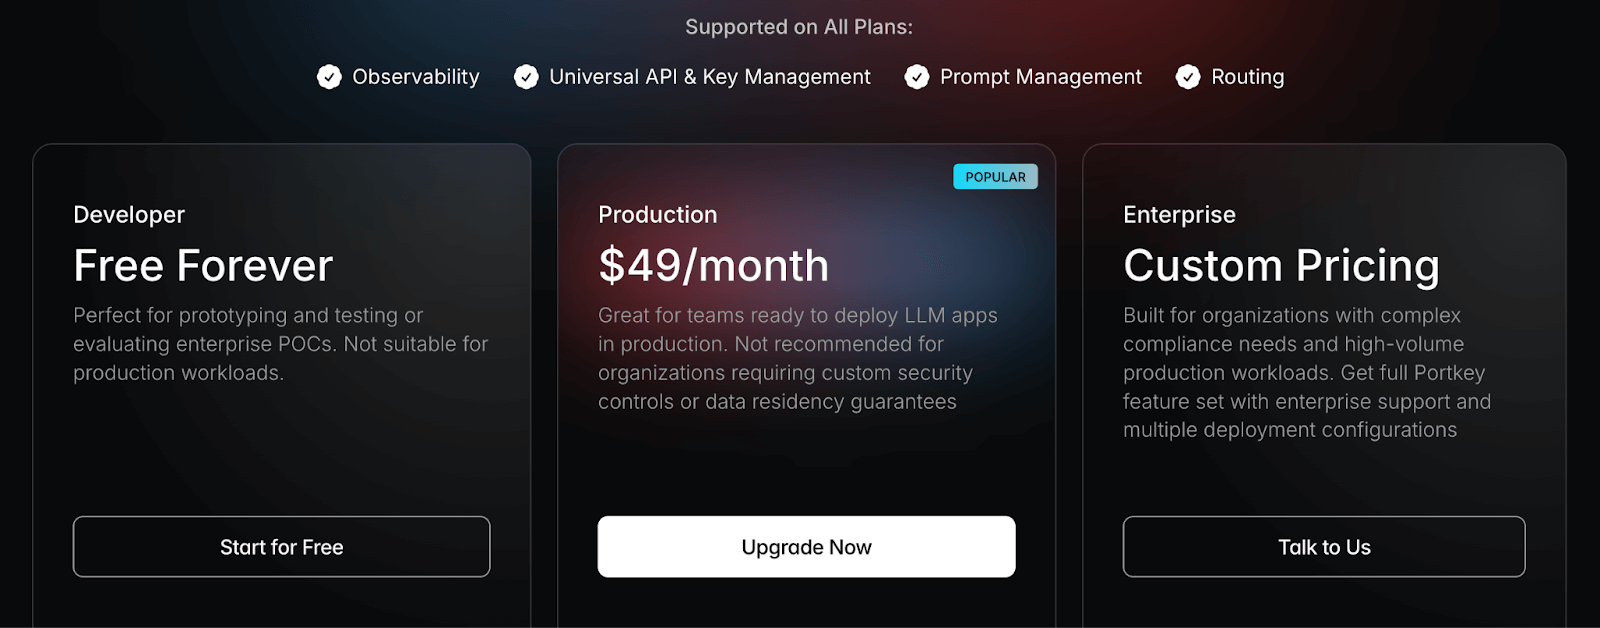
Pricing
Portkey has a free forever plan for developers and two paid plans:
- Production: $49 per month
- Enterprise: Custom pricing
Pros and Cons
Portkey’s major pro is that it combines LLM observability with production-ready tools, like unified API keys, multi-provider routing, guardrails, and more. The observability is deep because it logs 40+ traces, so you likely won’t miss anything in analysis. And since they’re OTel-compatible, they smartly avoid the lock-in concern by letting you export data.
The flip side is complexity and commitment. Adopting Portkey means routing through their gateway and adapting to their interface. For small projects, it’s overwork. Additionally, as a relatively new platform, there may be some rough edges or missing niche features.
How ZenML Helps You in Your Agentic AI Journey Apart from LLM Observability
ZenML is the most complete, pipeline-centric choice for teams that want unified MLOps + LLMOps with observability. This section shows how ZenML closes the agentic-AI ‘outer loop’ around whatever framework you use.
Orchestrate the Full Agentic Flow
Define your end-to-end agentic system as a pipeline of steps (a DAG). Move from local runs to production by swapping orchestrators without code rewrites.
ZenML supports Airflow, Kubeflow, Kubernetes, and even GitHub Actions, so you can run and schedule pipelines in the platforms you already use or trigger them from CI/CD. Parameterized configs let you A/B models, tools, or prompts without touching core logic.
Unified Visibility and Lineage
Every step yields versioned artifacts with tracked inputs and outputs. You can trace any agent decision back to the data, parameters, and code that produced it. The dashboard shows runs, DAGs, artifacts, and metadata so you can compare behavior across revisions. When connected to your repo, ZenML also records the git commit used for a run.
Continuous Evaluation and Feedback
Ship an evaluation loop alongside your agent. ZenML provides practical patterns for LLM-as-judge and human-in-the-loop reviews, so you can score outputs automatically and escalate edge cases to people. You can also wire alerts into Slack or Discord to notify the team of failures or review requests.
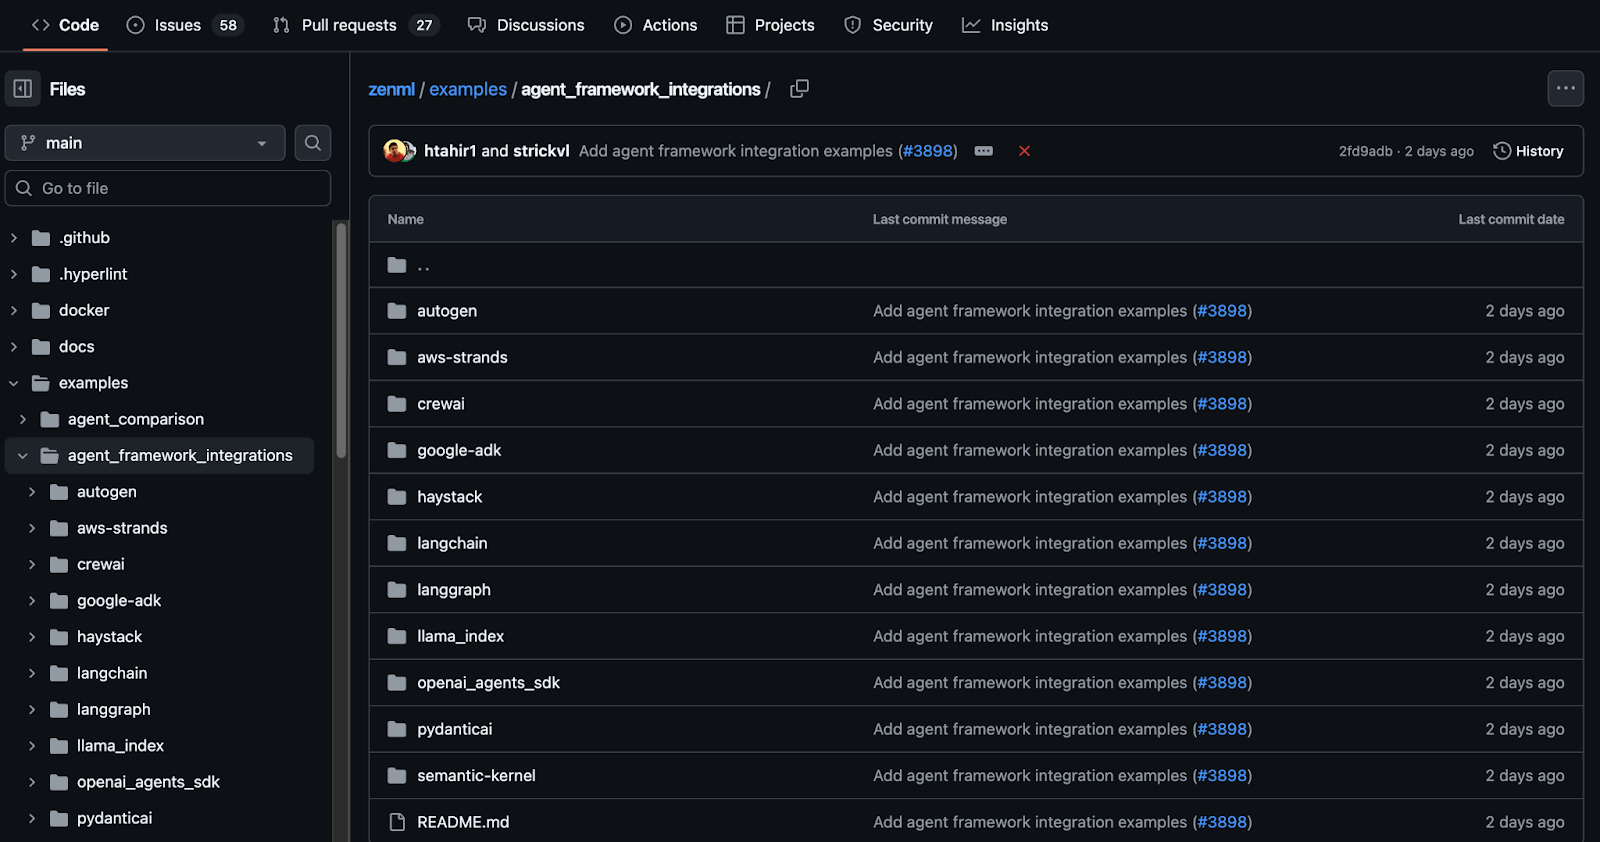
👀 Note: At ZenML, we have built several agent workflow integrations with tools like Semantic Kernel, LangGraph, LlamaIndex, and more. We are actively shipping new integrations that you can find on this GitHub page: ZenML Agent Workflow Integrations.
📚 Other relevant articles to read:
Which LLM Observability Tool Should You Use?
Choosing the best observability tool depends on your specific needs and context. As we’ve seen, these tools are not one-size-fits-all – each has its sweet spot:
- For teams seeking comprehensive MLOps and LLMOps integration: ZenML provides the most complete solution. Its pipeline-centric approach brings reproducibility and versioning to LLM applications while maintaining unified observability across your entire AI stack.
- For the LangChain Developer: LangSmith is the most natural and powerful choice. Its deep, seamless integration provides unparalleled visibility into chains and agents that other tools cannot easily replicate.
- For the Open-Source Advocate: Arize Phoenix and Traceloop OpenLLMetry are top-tier options.
- For the Enterprise using Datadog: Extending it with the Datadog observability suite is the simplest option. It adds the benefit of correlating your AI's performance with the health of your technology stack.
- For the Fast-Moving Startup: Helicone's proxy-based approach is best. It quickly gets a handle on costs and basic performance with minimal engineering overhead.
- For the Team Needing an All-in-One Solution: Vellum provides a tightly integrated experience that covers the entire application lifecycle.
If you’re interested in taking your AI agent projects to the next level, consider joining the ZenML waitlist. We’re building out first-class support for agentic frameworks (like LangGraph, CrewAI, and more) inside ZenML, and we’d love early feedback from users pushing the boundaries of what AI agents can do. With ZenML, you can seamlessly integrate whichever agent framework you choose into robust, production-grade workflows. Join our waitlist to get started.👇