On this page
Today, MLOps teams are stuck in a tool sprawl nightmare. You have one tool for training, another for tracking experiments, and a dozen scripts often held together with a thin layer of duct tape.
If you’re looking for a unifying layer, you’re not alone. MLRun, MLflow, and ZenML each offer unique features for pipeline orchestration and tracking.
MLflow is a widely used open-source platform for experiment tracking and model management. MLRun is the orchestration framework designed to automate the operational side of ML. And our tool, ZenML, is an extensible framework that glues your entire stack together.
While all three tools aim to manage MLOps, deciding which fits your infrastructure and use case is the real challenge.
In this MLRun vs MLflow vs ZenML article, we compare the three head-to-head across orchestration, tracking, and artifact management to help you decide which tool fits your platform needs.
MLRun vs MLflow vs ZenML: Key Takeaways
🧑💻 MLRun: A function-centric MLOps orchestration framework for running batch jobs and deploying online serving workloads on Kubernetes. It supports multiple runtimes and automates operational tasks like building container images, running jobs, and deploying real-time functions, often in conjunction with the Iguazio platform.
🧑💻 MLflow: One of the most widely used open-source platforms for experiment tracking and model management, with a popular tracking API, UI, and Model Registry.
🧑💻 ZenML: An MLOps + LLMOps framework that decouples your code from your infrastructure. It lets you write Python-native pipelines and deploy them to any orchestrator of your choice while connecting your tracking, storage, and deployment tools into a single workflow.
MLRun vs MLflow vs ZenML: Features Comparison
Before we head to an in-depth comparison, here’s a quick table showing how MLRun, MLflow, and ZenML differ in features and capabilities:
| Features | MLRun | MLflow | ZenML |
|---|---|---|---|
| Pipeline Orchestration | Function-based orchestration on Kubernetes (and locally), with workflows executed as DAGs via workflow engines (e.g., local or Kubeflow Pipelines). | Experiment tracking + model management. Not a general-purpose DAG/pipeline orchestrator (or scheduler) by itself. | Python-native pipelines (DAGs) with pluggable orchestrators and stack components. |
| Experiment Tracking | Context-based logging and framework helpers (e.g., apply_mlrun()) for automatic logging of common artifacts/metrics. | Core capability, with a tracking API, UI, autologging, and a model registry. | Automatically tracks pipeline runs/steps/artifacts and integrates with external experiment trackers (e.g., MLflow, W&B, Comet) for metrics UIs. |
| Execution and Scheduling | Supports retry policies for runs and cron-style scheduling for jobs/workflows; execution can be local or Kubernetes-based depending on the chosen runtime/engine. | No scheduler, depends on external systems | Inherits scheduling from chosen orchestrator |
| Artifact Management | Versions all outputs with metadata and lineage | Artifacts are logged per-run; model versions live in the Model Registry; dataset inputs can be tracked/versioned via mlflow.data (metadata + digests via mlflow.log_input). | Tracks and links all step outputs automatically |
| Integration | Connects to Spark, Kafka, cloud storage, and more | Supports ML libraries and major cloud services | Stack-based integrations with 50+ MLOps tools |
Feature 1. Pipeline and Workflow Orchestration
How you define workflows and how they execute (local vs. remote) determines whether your ML code is just a collection of loosely coupled scripts or a reproducible production system. Let’s compare how MLRun, MLflow, and ZenML differ in their approach.
MLRun
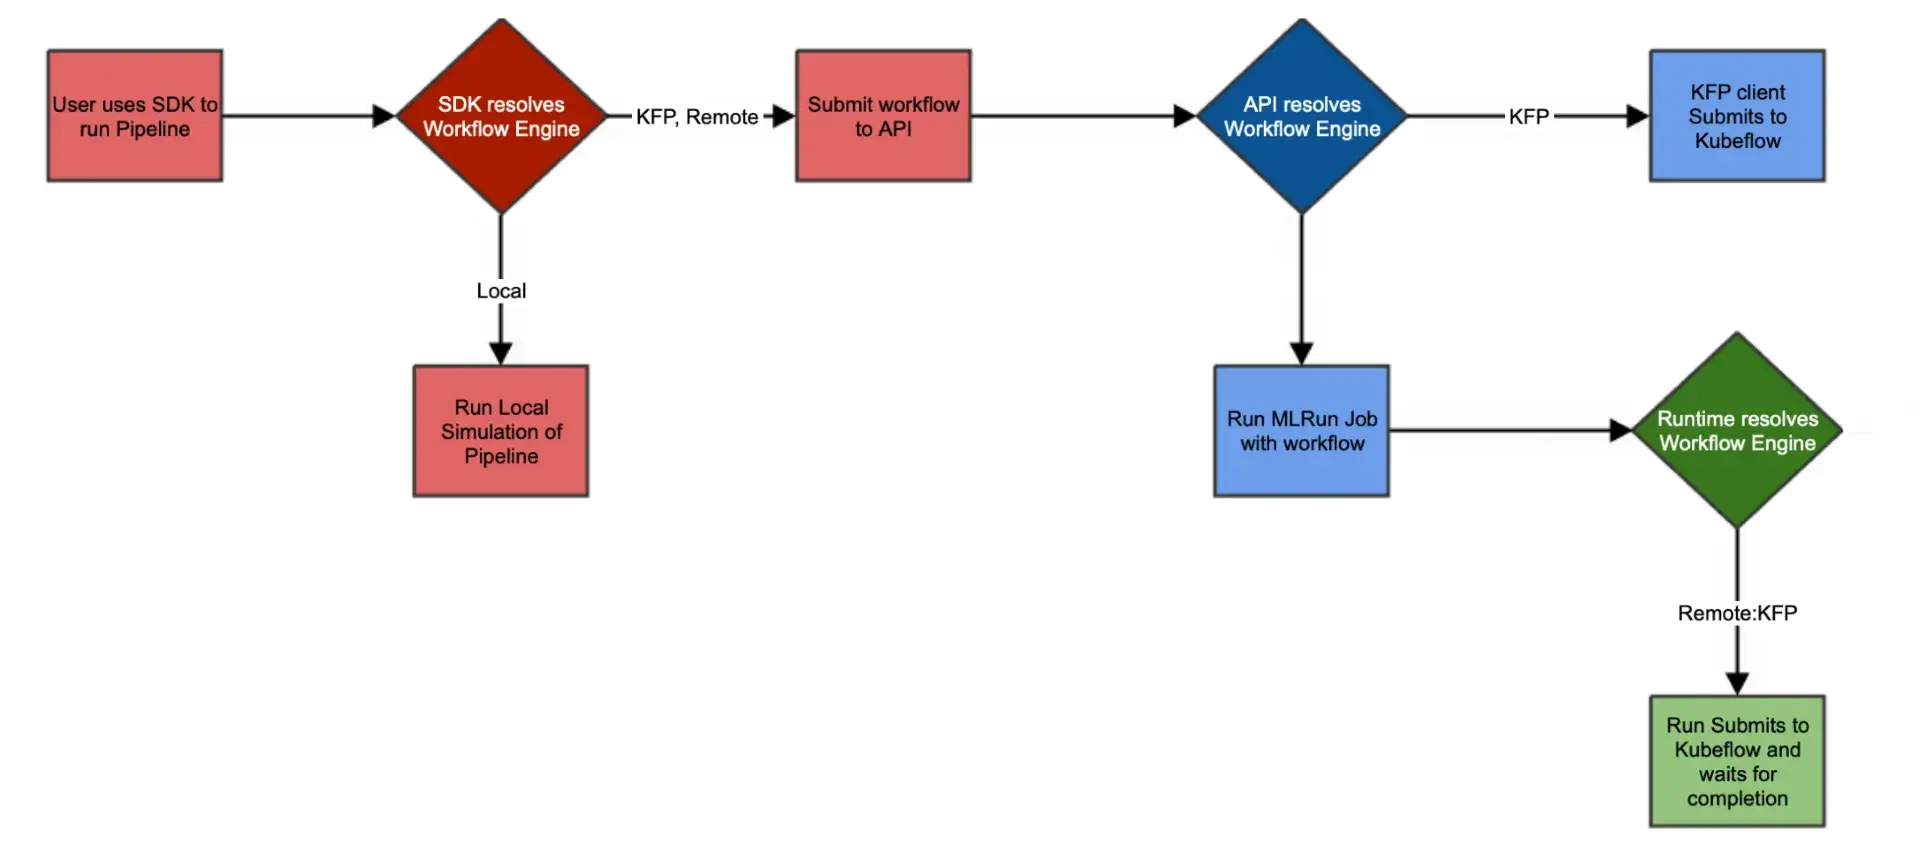
MLRun is an orchestration framework where execution is centred around “functions” that can run locally or on Kubernetes across multiple runtimes (e.g., batch jobs, real-time Nuclio functions, serving graphs, Dask, Spark, MPIJob).
Workflows are defined as Python workflow functions and executed as DAGs via workflow engines such as local execution or Kubeflow Pipelines (KFP), using the MLRun project/workflow APIs. The goal is to reduce Kubernetes boilerplate while still deploying on Kubernetes.
For example, it lets you create an MLRun project, register functions, and set a workflow file:“
import mlrun

project = mlrun.get_or_create_project("myproject", context="./")

project.set_function(
    name="get-data",
    func="get_data.py",
    kind="job",
    image="mlrun/mlrun",
)

project.set_function(
    name="train-model",
    func="train.py",
    kind="job",
    image="mlrun/mlrun",
)

project.set_function(
    name="deploy-model",
    func="hub://v2_model_server",
)

project.set_workflow("pipeline", "pipelines/train_pipeline.py")
project.save()
The pipeline script (using the Kubeflow DSL) orchestrates steps via mlrun.run_function() or mlrun.deploy_function(), passing outputs between steps.
Because it uses serverless concepts, it handles resource scaling effectively and can automate the container build process (Dockerfiles) for your functions.
MLRun also supports advanced execution features like retries and cron-style scheduling: you can schedule jobs or workflows by passing a cron expression via the schedule parameter.
MLflow
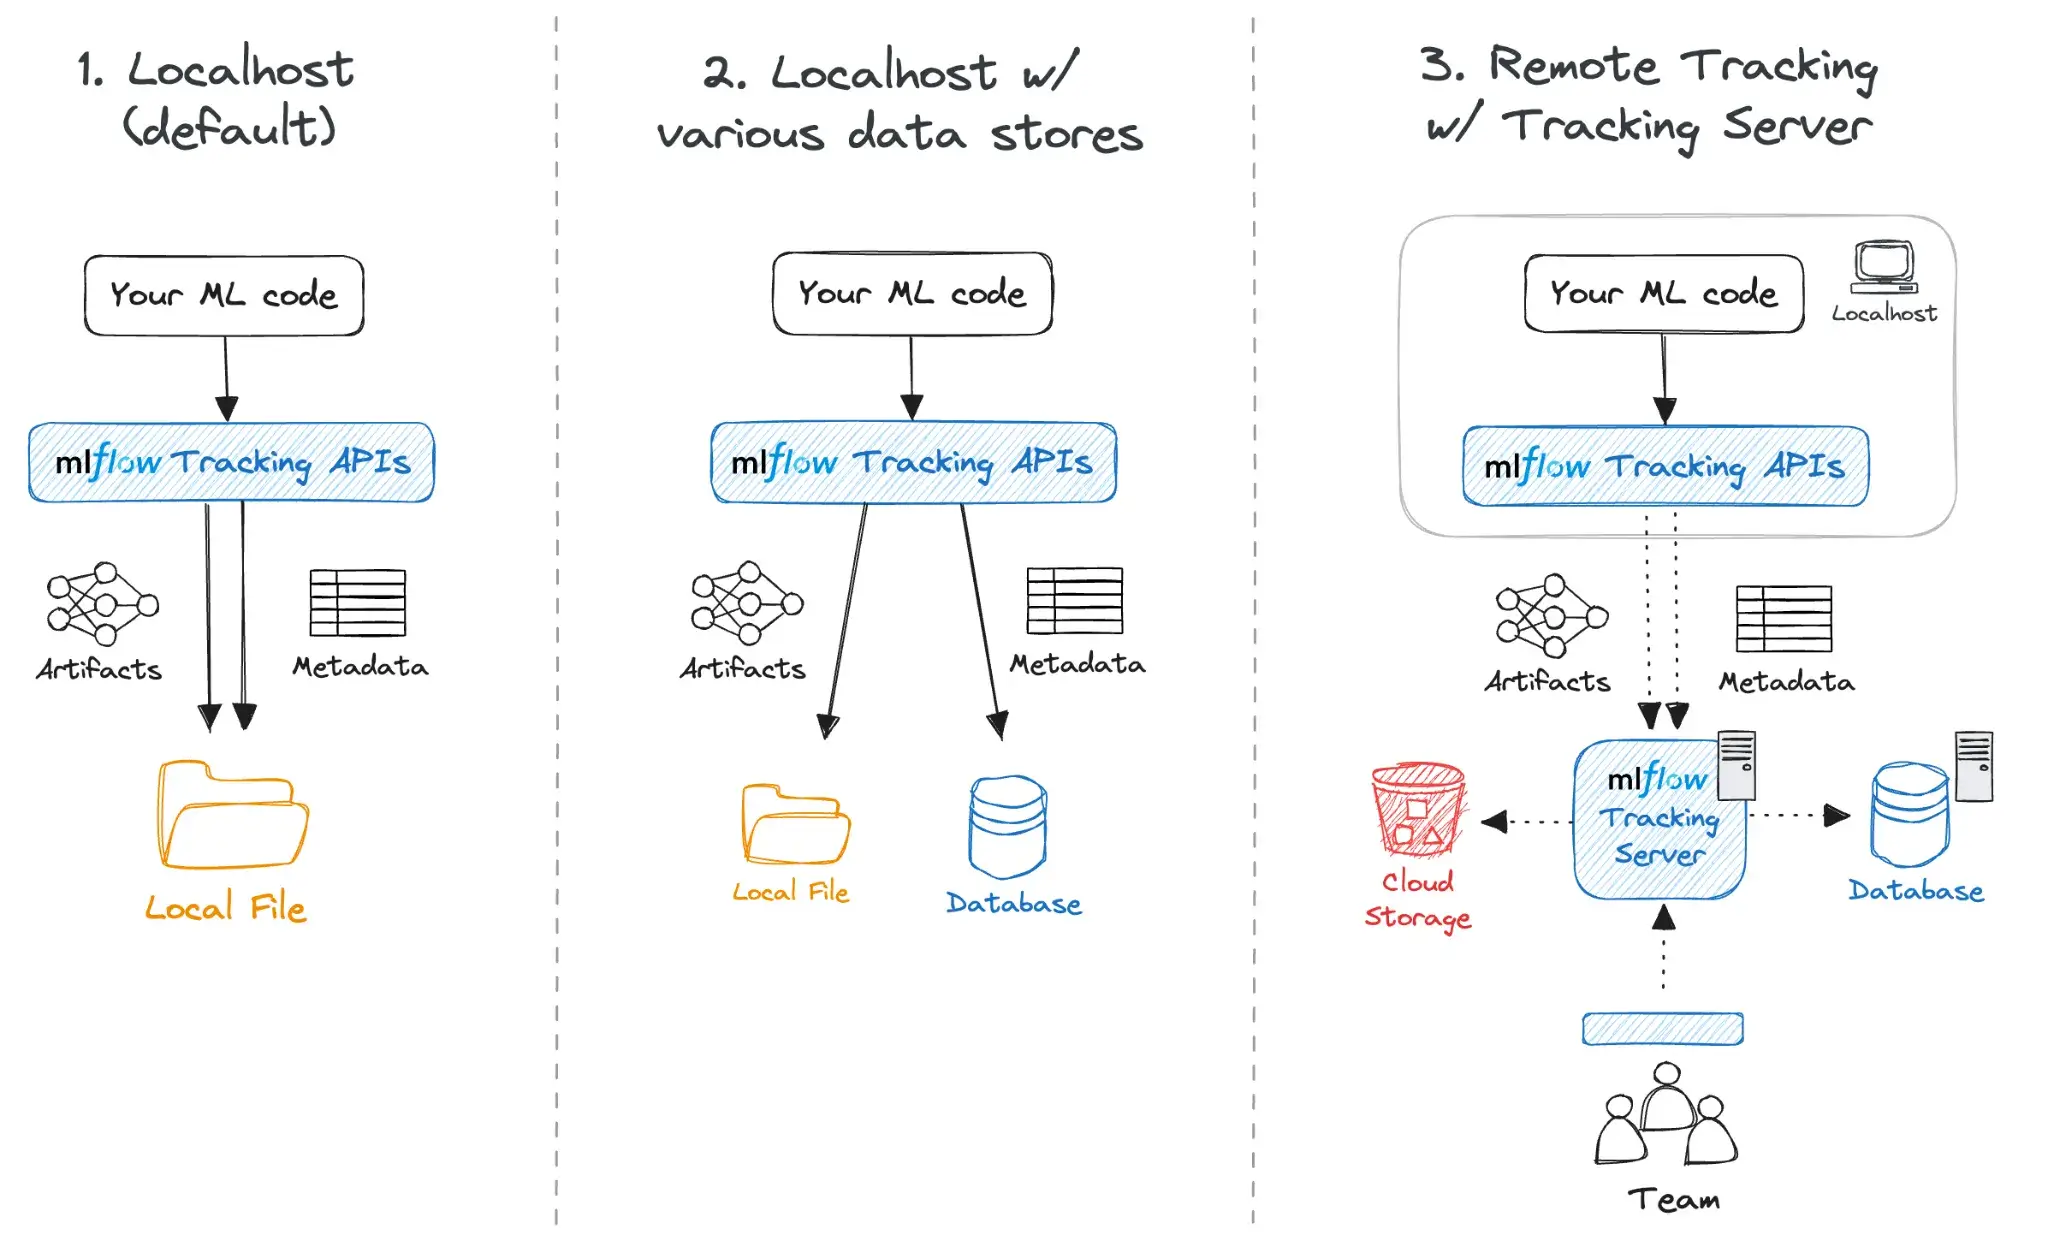
MLflow itself does not provide a workflow or DAG engine. In fact, it’s not an orchestrator in the first place. It’s primarily an experiment tracking tool that allows you to run a single training or evaluation job with mlflow.start_run() and then log results.
Let’s say you have a typical ML workflow: preprocessing → training → evaluation → deployment. MLflow does not orchestrate these stages for you; teams typically run each stage as separate scripts or tasks and log each run for tracking. You write separate scripts for each stage, wrap them in mlflow.start_run(), and log their inputs/outputs.
However, MLflow won’t chain or schedule multiple steps for you. If you want to chain them, you usually have to script it manually or trigger MLflow runs from an external orchestrator such as Airflow, Kubeflow, or another system.
In that case, MLflow is treated as a side passenger and not the execution driver. However, this separation is intentional and fits MLflow’s appeal of not forcing any infrastructure on you. This way, it remains lightweight, self-contained, and data scientists can run MLflow tracking in any script.
For example, a simple MLflow script might look like:
import mlflow
import mlflow.sklearn
from sklearn.ensemble import RandomForestClassifier

# Assume X_train, y_train, X_test, y_test are already defined.
with mlflow.start_run():
    model = RandomForestClassifier(n_estimators=100, random_state=42)
    model.fit(X_train, y_train)

    mlflow.log_param("n_estimators", model.n_estimators)
    mlflow.log_metric("accuracy", model.score(X_test, y_test))
    mlflow.sklearn.log_model(model, artifact_path="rf_model")
ZenML
ZenML provides native pipeline orchestration with a Pythonic DSL. You annotate functions with @step and compose them in a @pipelineto structure your logic.
Here’s how you start a simple ZenML workflow:
import pandas as pd
from zenml import step, pipeline

@step
def preprocess_data(data_path: str) -> pd.DataFrame:
    df = pd.read_csv(data_path)
    # preprocessing logic
    return df

@step
def train_model(data: pd.DataFrame) -> object:
    # training logic
    return "trained_model_placeholder"

@pipeline
def my_pipeline(data_path: str) -> None:
    processed = preprocess_data(data_path)
    train_model(processed)

if __name__ == "__main__":
    my_pipeline(data_path="data/raw.csv")
A key principle in ZenML is the decoupling of pipeline definition and execution. You can run this pipeline locally, or register an orchestrator like Airflow, Kubeflow, or Docker and re-run without changing any code.
ZenML supports step-level caching (to reuse unchanged step outputs across runs), and scheduling is handled through the capabilities of supported orchestrators (ZenML wraps the orchestrator’s scheduling system). Parallel execution and other runtime behaviour depend on the orchestrator you choose.
For teams that want ML-specific workflows without the complexity of DAG code or container orchestration, this is a cleaner, faster way to work.
Bottom line: If you want Python-first pipelines with pluggable orchestrators and built-in artifact/metadata tracking, ZenML is a strong fit. If you want Kubernetes-native execution and end-to-end operational automation around functions and serving, MLRun may fit better.
Feature 2. Experiment Tracking
Experiment tracking is needed to know which hyperparameters produced the best model. Without it, your pipeline is building on a set-and-forget loop.
MLRun
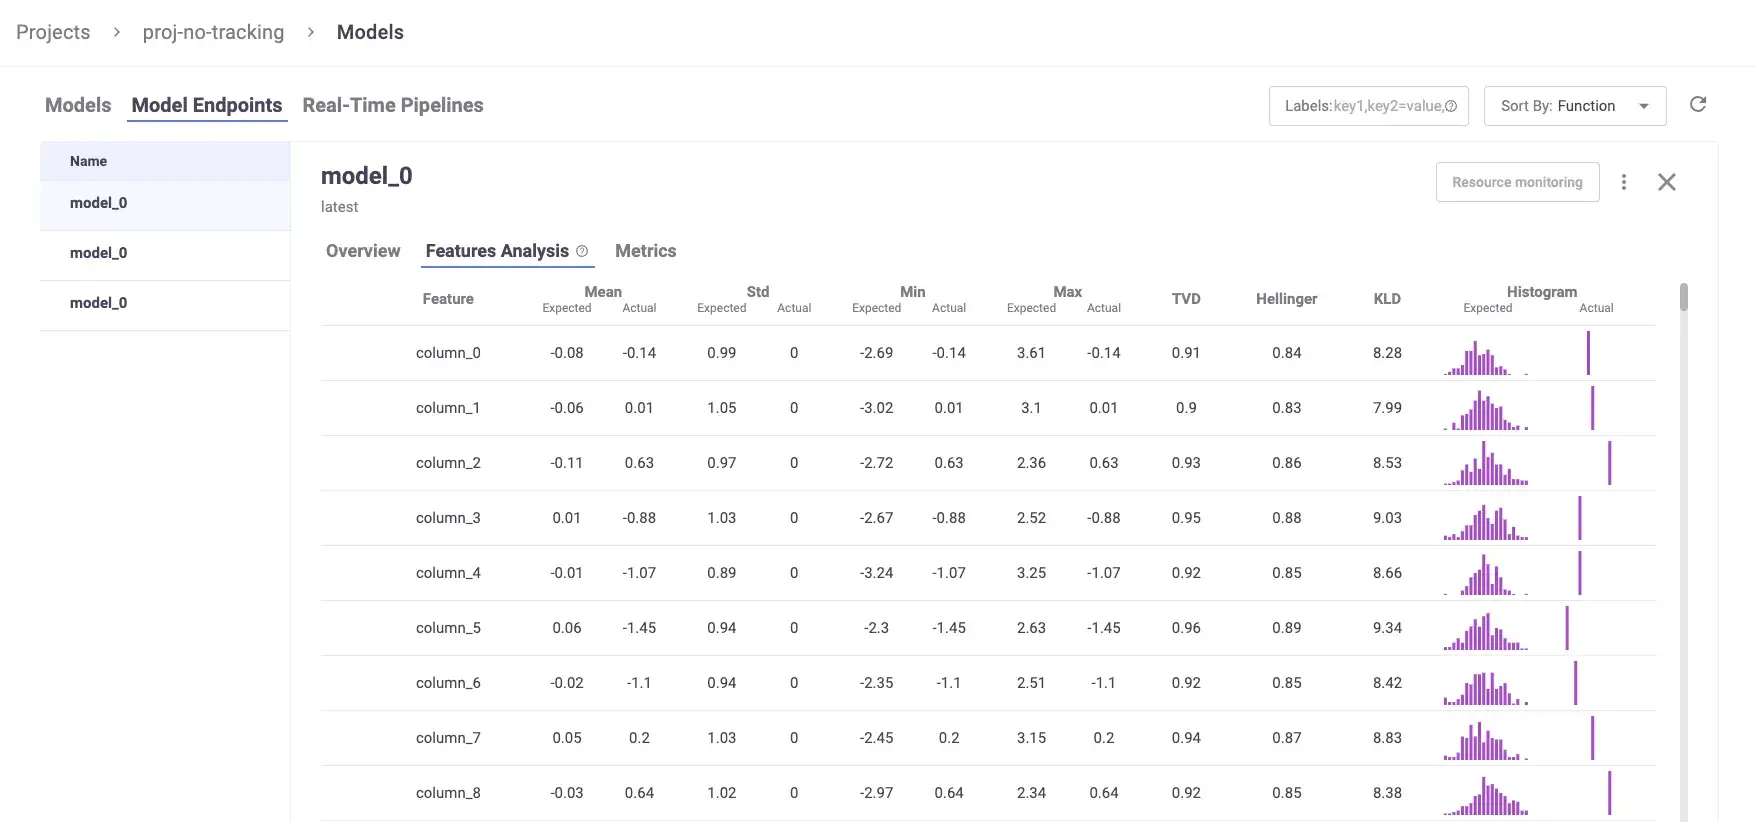
MLRun supports automated experiment tracking via framework-specific helpers such as apply_mlrun() (e.g., for scikit-learn). When used inside an MLRun function, apply_mlrun() can automatically log common evaluation plots, metrics, and model artifacts to the MLRun tracking backend.
For example, this single call:“
from mlrun.frameworks.sklearn import apply_mlrun

apply_mlrun(
    model=model,
    model_name="iris_model",
    x_test=x_test,
    y_test=y_test,
)
Logs the following outputs automatically:
- Plots, including loss convergence, ROC, and confusion matrix
- Metrics like accuracy, recall, loss
- Dataset artifacts, like the dataset used for training and/or testing
- Versioning, so the model is tagged and stored with a unique ID
- Run context metadata (e.g., run ID, project/name, parameters, labels/annotations, inputs/outputs) plus logs/results/artifacts that you explicitly record during execution
All of this is tied to a single run ID and stored in MLRun’s metadata backend, which keeps the lineage intact. You can also define and manage feature sets, link them to models, and log them as structured entities.
MLRun lets you use the Iguazio UI provided dashboards to visualize it. However, even without Iguazio, open-source MLRun deployments can be used via the Python SDK and REST API, and include an MLRun service/UI component when deployed as part of the MLRun stack.
MLflow
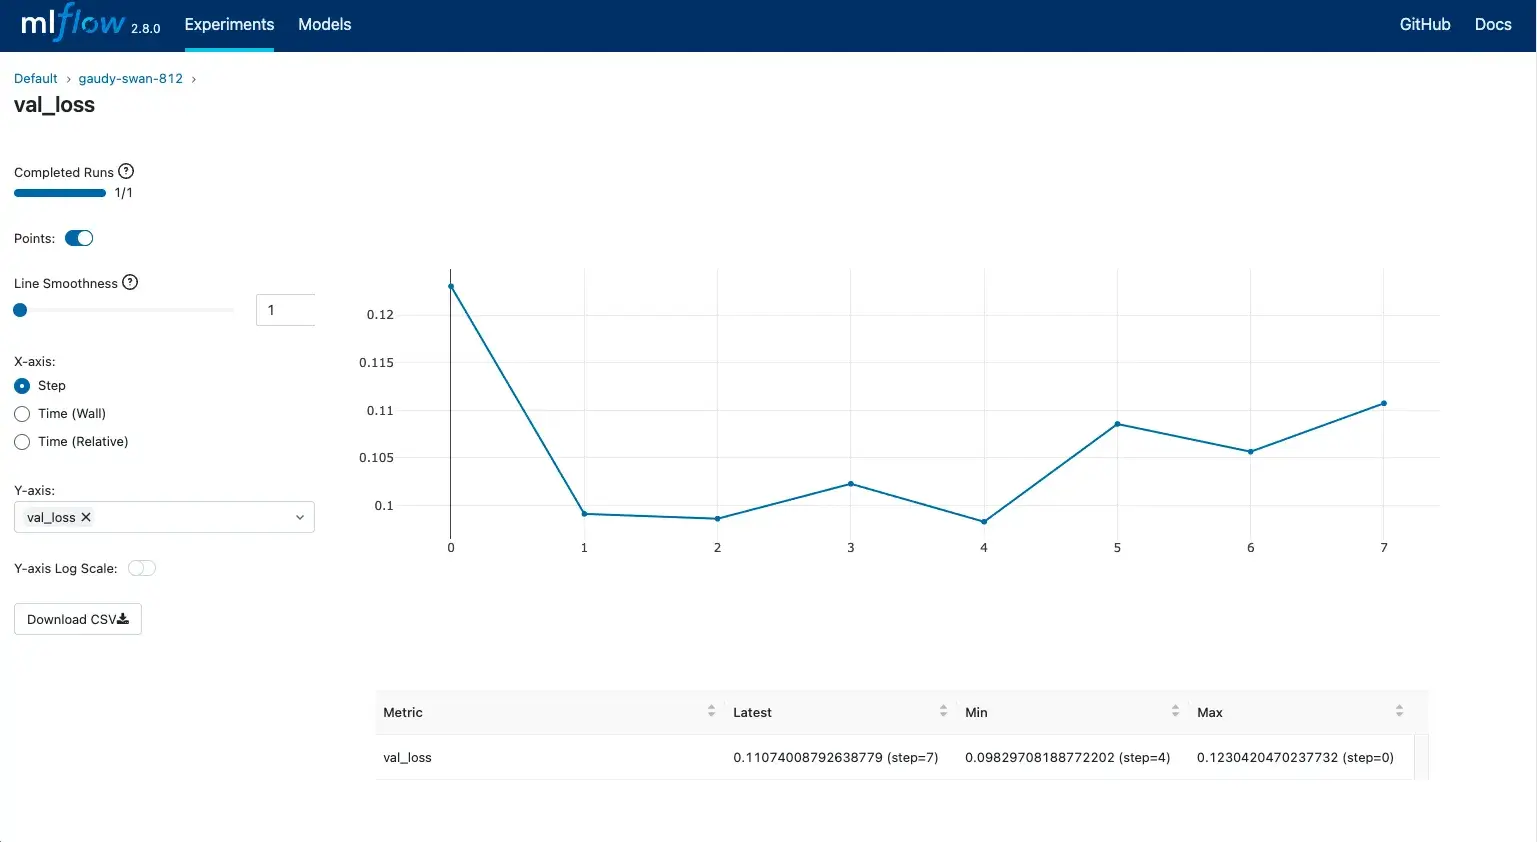
MLflow is widely used for experiment tracking and model management, offering a consistent tracking API and a UI for comparing runs.
It lets you track experiments with a consistent API that integrates with any ML stack, along with a graphical UI to visualize experimental runs.
It also supports autologging for popular ML frameworks like scikit-learn, PyTorch, and TensorFlow.
Each run is stored under a specific experiment, which groups together related runs for a project and can be compared side-by-side in the UI.
You can structure complex workflows with nested runs, and manage models through its built-in Model Registry with versioning, tags, and aliases (Model Registry ‘stages’ like Staging/Production are deprecated in MLflow 2.9+ in favor of aliases).
Behind the scenes, MLflow can be configured in multiple modes:
- Local mode: Run MLflow locally with file-based storage, which is convenient for personal projects or ad hoc scripts.
- Tracking server: Run a central MLflow tracking server backed by a database and a shared artifact store for team usage.
- Managed MLflow: Use a managed offering from a platform/cloud provider to avoid operating the tracking infrastructure yourself.
MLflow is widely integrated across the MLOps ecosystem. Many orchestration and platform tools (including MLRun and ZenML) offer MLflow integrations so teams can standardize on MLflow for tracking while using other systems for orchestration and infrastructure.
ZenML
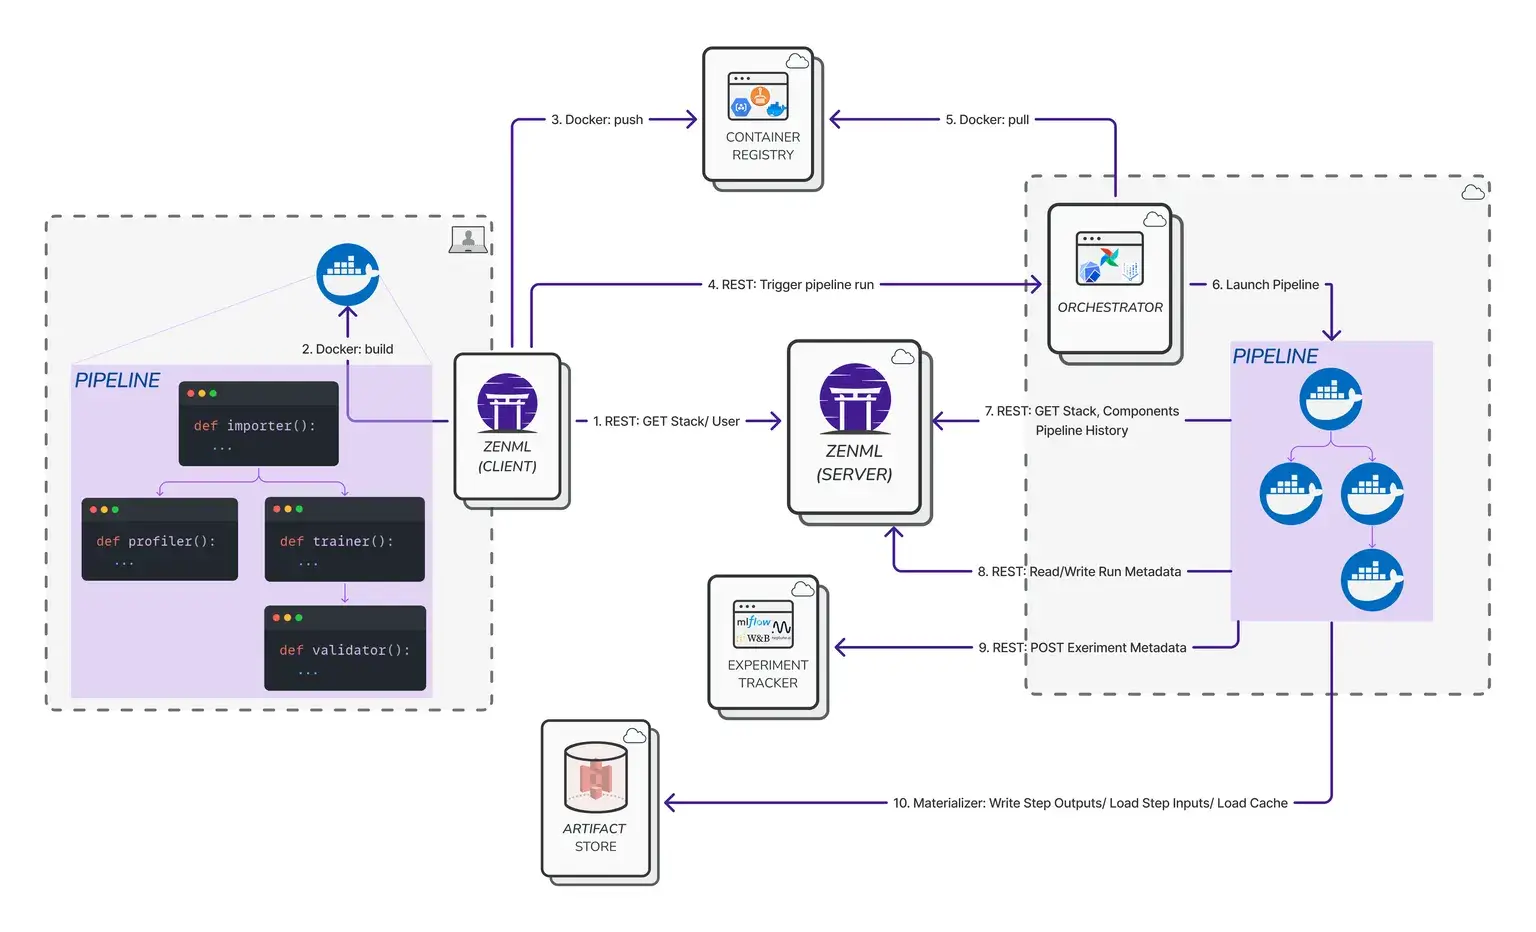
ZenML is not an experiment tracker at core, but is tracking-aware through its metadata store. When you run a pipeline in ZenML, it’s treated as an experiment, and ZenML automatically records information about steps, artifacts, and runs in a metadata database.
This tracking is built into the pipeline execution, and you don’t need to write extra logging code. You can also attach custom metadata to pipeline runs, steps, and artifacts using ZenML’s metadata capabilities.
The benefit ZenML adds is context. It links the MLflow experiment (or any experiment run from any other experiment tracker that ZenML integrates with) results to the specific pipeline run, the code version, and the data artifacts that created them.
ZenML includes a dashboard for visualising pipelines, runs, steps, artefacts, and associated metadata. Some advanced dashboard views (e.g., experiment comparison or full model control-plane features) depend on the ZenML edition.
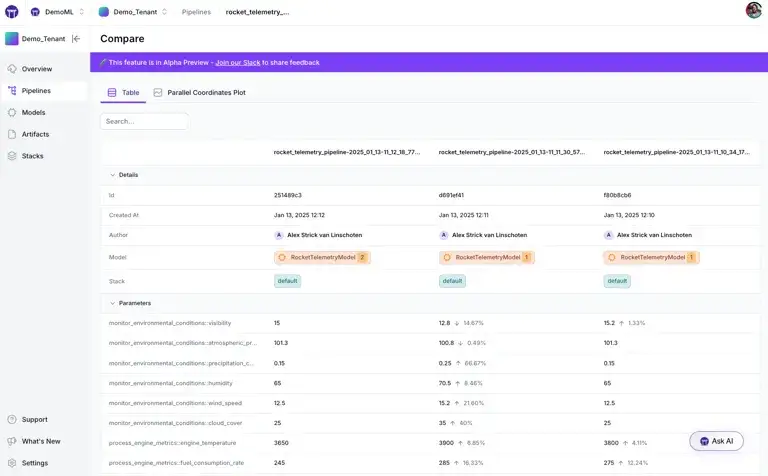
It also integrates with external tools like MLflow and Weights & Biases. You can plug these into your stack and get side-by-side experiment comparisons through their dashboards.
Bottom line: MLflow is the winner for pure tracking capabilities. It has a polished tracking UI and automatic logging for popular ML frameworks. MLRun provides strong auto-logging and includes its own open-source UI; Iguazio also offers an integrated UI experience on top of MLRun for teams using the Iguazio platform. However, you often get the best results by using MLflow inside ZenML to get both granular metrics and pipeline context.
Feature 3. Artifact Management
If you can’t trace a model back to the dataset that trained it, you have not achieved reproducibility. Therefore, you and most MLOps teams look for a tool to manage artifacts.
MLRun
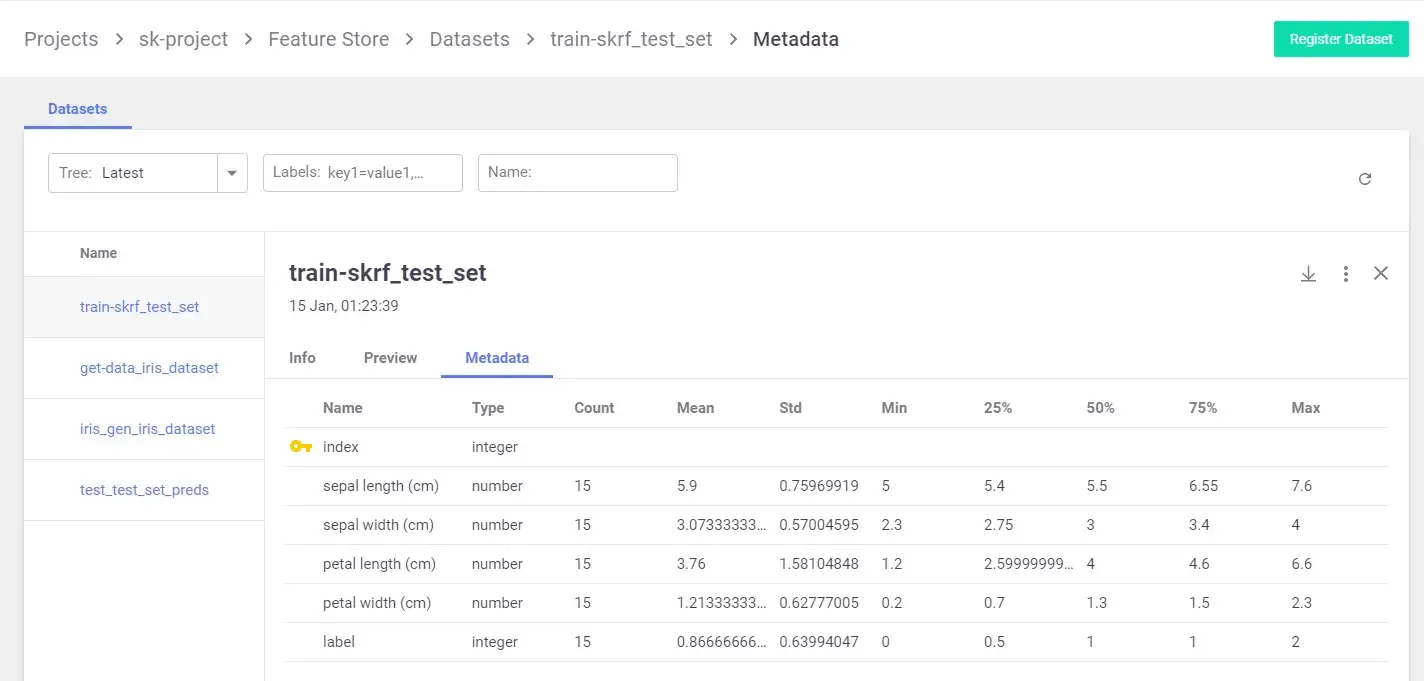
MLRun uses the concept of DataItems to track artifacts. When you call context.log_artifact() inside an MLRun function, the file/object you log is stored in the configured artefact store and linked to the run metadata.
Each artifact is linked to the exact run that produced and generates a unique URI, for example, store://artifacts/project/name:tag, which makes artifacts easy to reference, retrieve, or tag as latest.
If you’re using Iguazio, you get a UI to browse artifacts by type, version, or producing function. For open-source users, the SDK and REST API offer full access to artifact queries and lineage. It works well, but it is tightly coupled to the MLRun execution model.
MLflow
MLflow supports artifact logging during runs, but most artifact organization is still run-scoped: when you call mlflow.log_artifact(...), files are stored under a run-specific directory in your configured artifact store.
For structured lifecycle features, MLflow provides:
- Model versioning in the Model Registry (with metadata and recommended deployment workflows increasingly centered on aliases).
- Dataset tracking via
mlflow.dataandmlflow.log_input, which records dataset metadata plus a digest/fingerprint and source information so you can reproduce and audit which dataset versions were used for training/evaluation.
That said, MLflow generally does not act as a full data versioning system that stores and manages large datasets as independently versioned entities. Teams typically pair MLflow with their data platform (lakehouse/object storage + table versioning, DVC, etc.) for the underlying data lifecycle while using MLflow to capture lineage and references.
The only place MLflow provides structured versioning is the Model Registry. You can fetch or transition versions using the API or UI. However, this versioning is scoped only to registered models. Things like datasets, feature sets, or intermediate outputs are not versioned unless you do it explicitly.
There’s also no built-in comparison across artifact types. You can inspect artifacts per run, but comparing output files or visualizations across runs requires manual inspection or external tooling. MLflow’s strength lies in storage flexibility, not artifact lineage.
ZenML
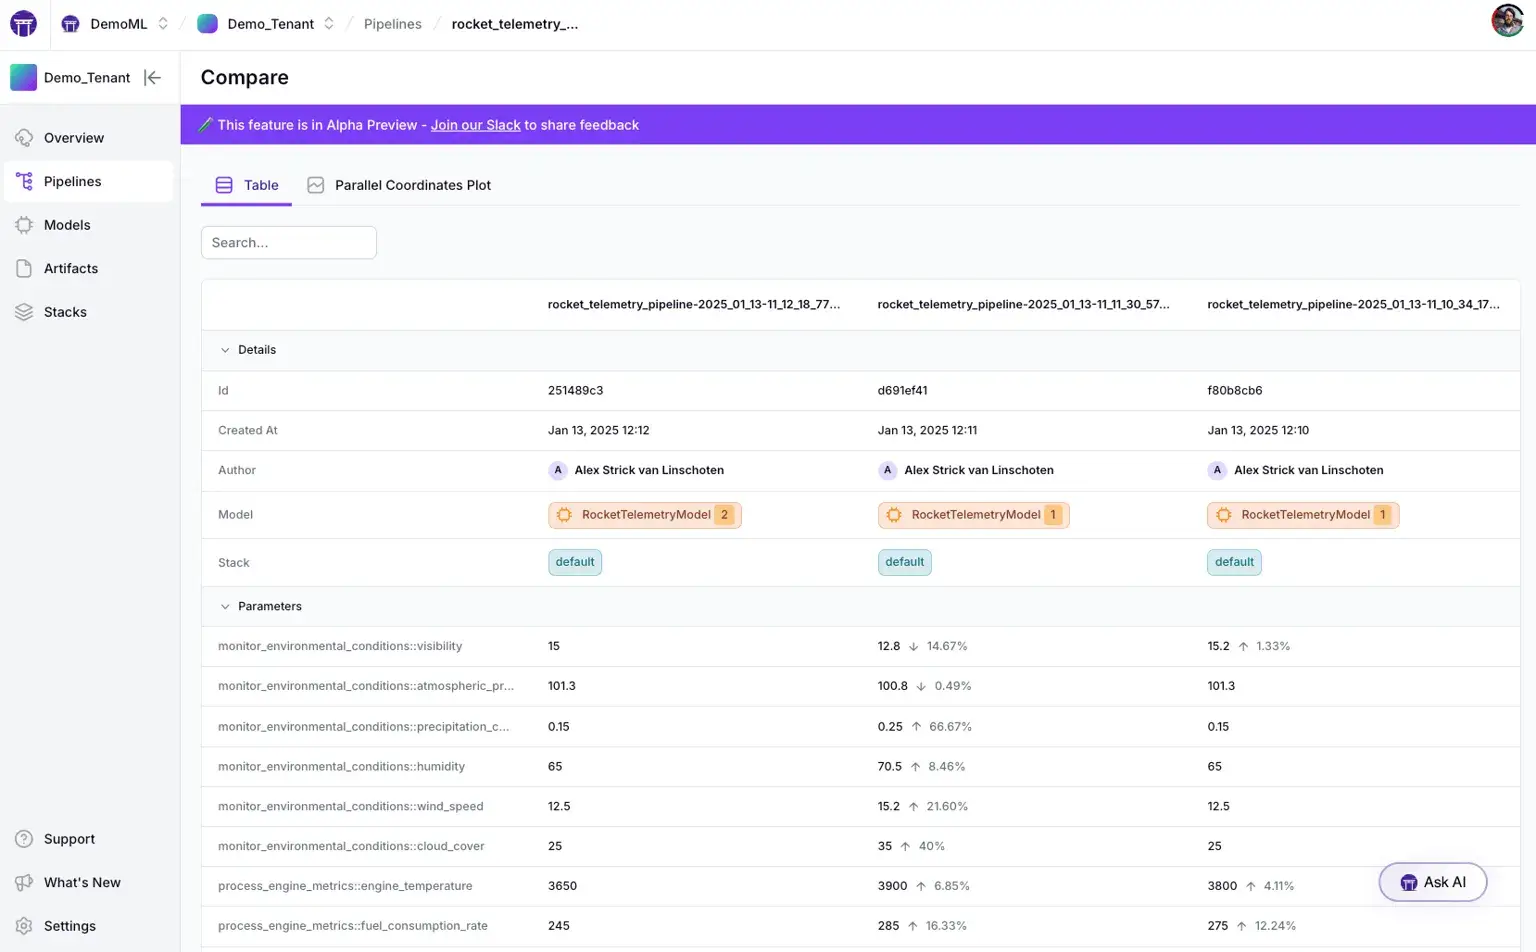
Every time a @step finishes, ZenML automatically serializes the output and saves it to the ZenML Artifact Store, which can be on a local disk or in the cloud.
Each artifact carries rich metadata: it’s linked to the exact pipeline, step, and run that produced it. ZenML tracks relationships between pipelines, runs, steps, and artefacts in its metadata store (including timestamps and lineage). Caching and reproducibility mechanisms rely on content/configuration-derived identifiers (e.g., hash-based cache keys) to decide when a step output can be reused.
When the next step runs, ZenML retrieves that specific version. This creates traceable lineage between pipeline runs, step executions, and the artifacts they produce. You can look at a model in the ZenML Dashboard and see exactly which dataset version, code commit, and upstream step produced it.
ZenML also introduces the concept of a Model entity, which serves as a container for logically grouped artifacts. This makes it easy to inspect how a specific model was trained and what it depended on.
Bottom line: ZenML provides the most comprehensive artifact management. It versions and tracks every pipeline output with full lineage without requiring manual logging code in your steps. MLRun also offers robust artifact versioning and metadata, while MLflow requires more manual steps for data versioning and relies on the Model Registry for model versions.
MLRun vs MLflow vs ZenML: Integration Capabilities
Here are the different MLOps tools that these three platforms integrate with to make your MLOps flawless:
MLRun
MLRun was built to integrate deeply with modern data and ML infrastructure. It provides SDK-level support and native connectors for a wide range of tools across compute, storage, and deployment. You can manage the full pipeline, from ingestion to training to serving, in one place.
Key integrations include:
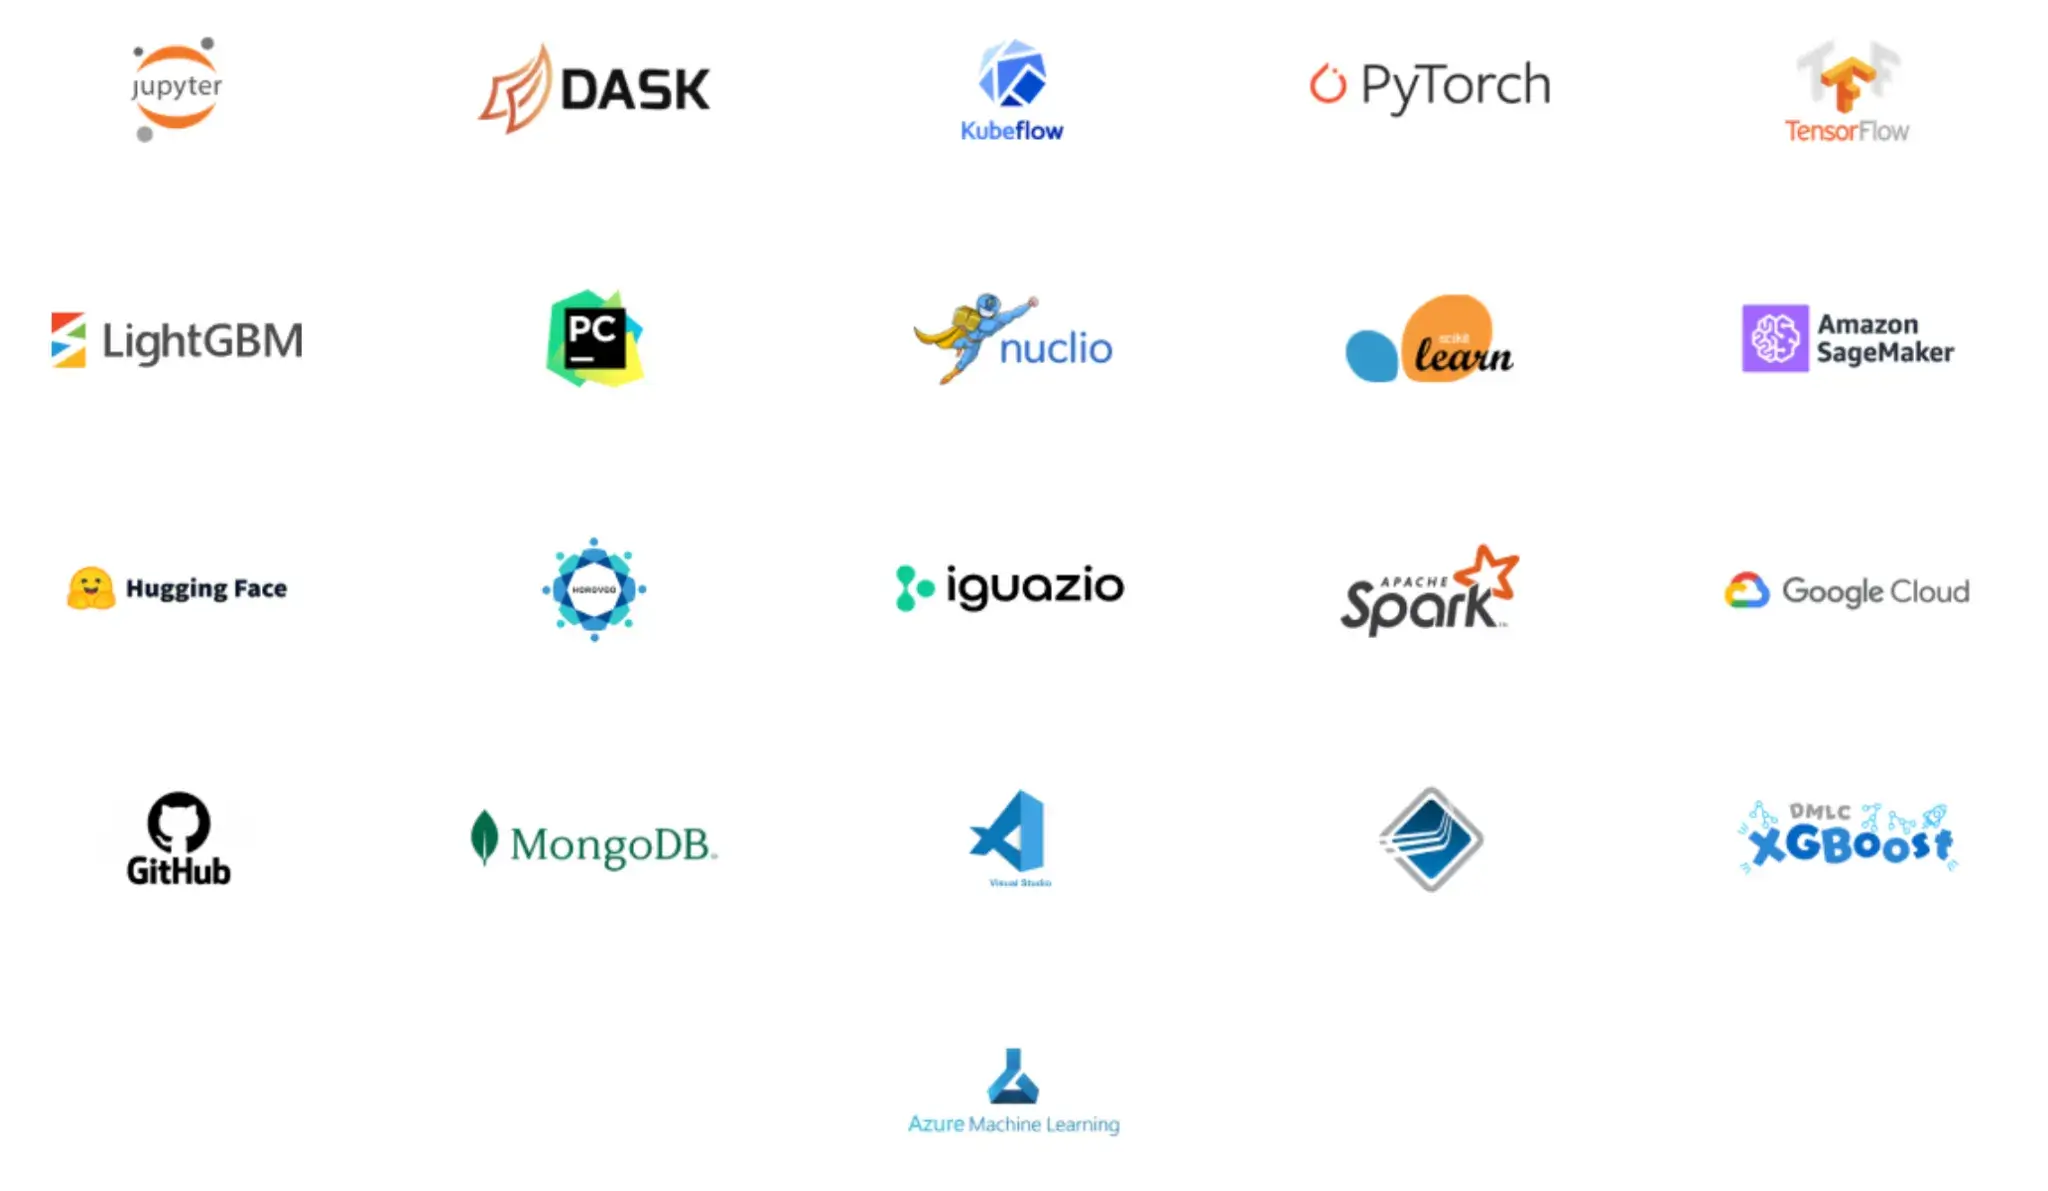
- Execution runtimes: Kubernetes jobs, real-time Nuclio functions, serving graphs, Dask, Spark, MPIJob (Horovod) and more.
- Data stores and artifact backends: Object storage and filesystems (e.g., S3, Azure object storage, Google cloud object storage), plus additional backends in the MLRun ecosystem.
- Streaming and eventing: Kafka and cron/HTTP-based triggers (plus Iguazio-specific backends where applicable).
- Cloud service integrations: MLRun includes examples and demos integrating with services such as AWS SageMaker and AzureML as part of broader ML pipelines.
MLflow
MLflow supports autologging for many popular ML frameworks (e.g., scikit-learn, PyTorch, TensorFlow, XGBoost) and can be used across a wide range of infrastructure setups.
On the infrastructure side, MLflow is flexible too:
- Tracking server: SQLite, MySQL, or PostgreSQL
- Artifact store: Local disk, S3, GCS, Azure Blob, etc.
- Serving/Deployment: Supports local model serving and deployments to targets like SageMaker and Azure ML, and integrates with Kubernetes-native serving frameworks like KServe and Seldon Core.
MLflow’s open-source model format (MLmodel) is widely supported, making it easy to plug into other tools. It’s not meant to handle data ingestion or orchestration, but it logs from almost anywhere with minimal friction.
ZenML
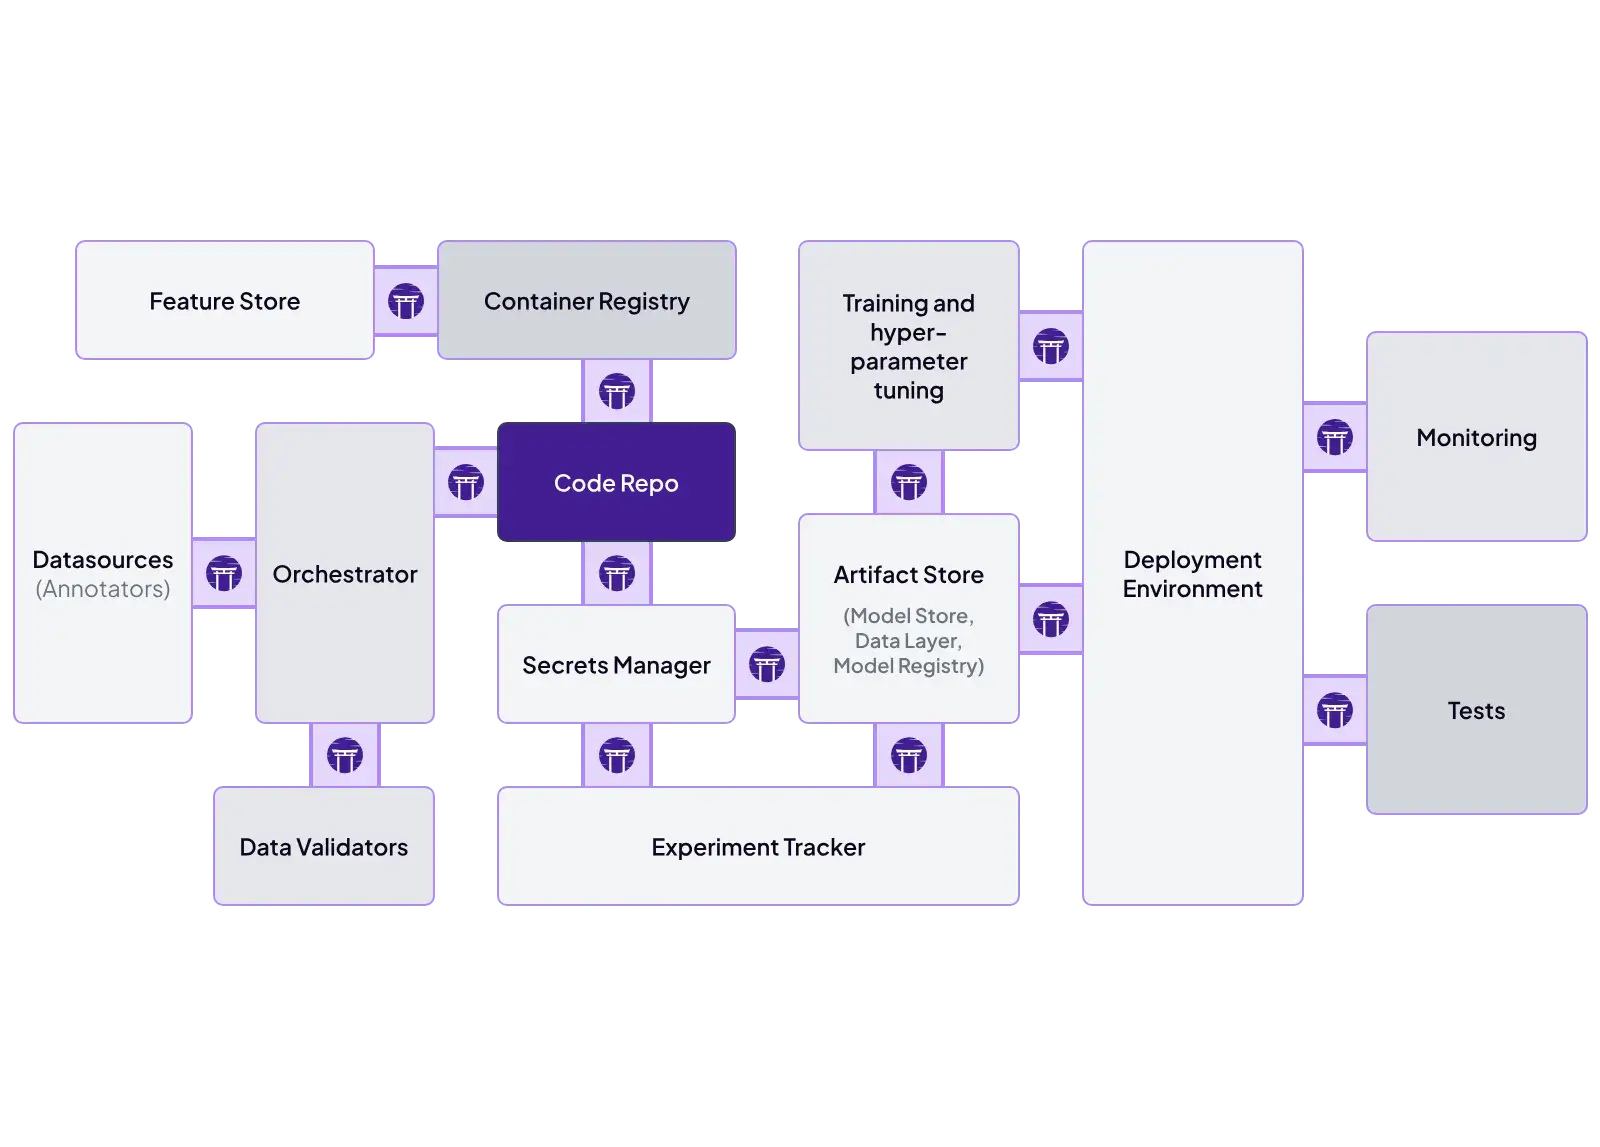
ZenML’s architecture is explicitly modular. It uses a stack concept where each part, whether it’s an orchestrator, tracker, artifact, or metadata store, has multiple connectors.
Some key ZenML integrations include:
- Orchestrator: Airflow, Kubeflow, Skypilot, or local
- Experiment Tracker: MLflow, W&B, Comet
- Deployers: ZenML provides a deployer abstraction that standardizes how models are deployed across different serving backends, like KServe, Seldon, or MLflow-based serving.
- Container Registry: Docker Hub, ECR, GCR
ZenML even lets you wrap external pipelines: one ZenML pipeline step can invoke an Airflow DAG or a SageMaker job. This makes ZenML highly flexible: it can integrate with existing workflows and replace components without breaking pipelines.
MLRun vs MLflow vs ZenML: Pricing
All three tools are open source under permissive licenses, so their core editions incur no licensing costs. However, when moving to a cloud setup, their pricing increases.
MLRun
MLRun is a free, open-source MLOps orchestration framework. Costs associated with MLRun typically depend on the infrastructure or managed service you choose for deployment.
MLflow
MLflow is open-source and free to use. You can self-host it, which incurs infrastructure and maintenance costs. Managed MLflow services, like those on Databricks or AWS, charge based on the compute and storage resources you consume.

📚 Read this guide and explore the top MLflow alternatives.
ZenML
ZenML is also open-source and free to start.
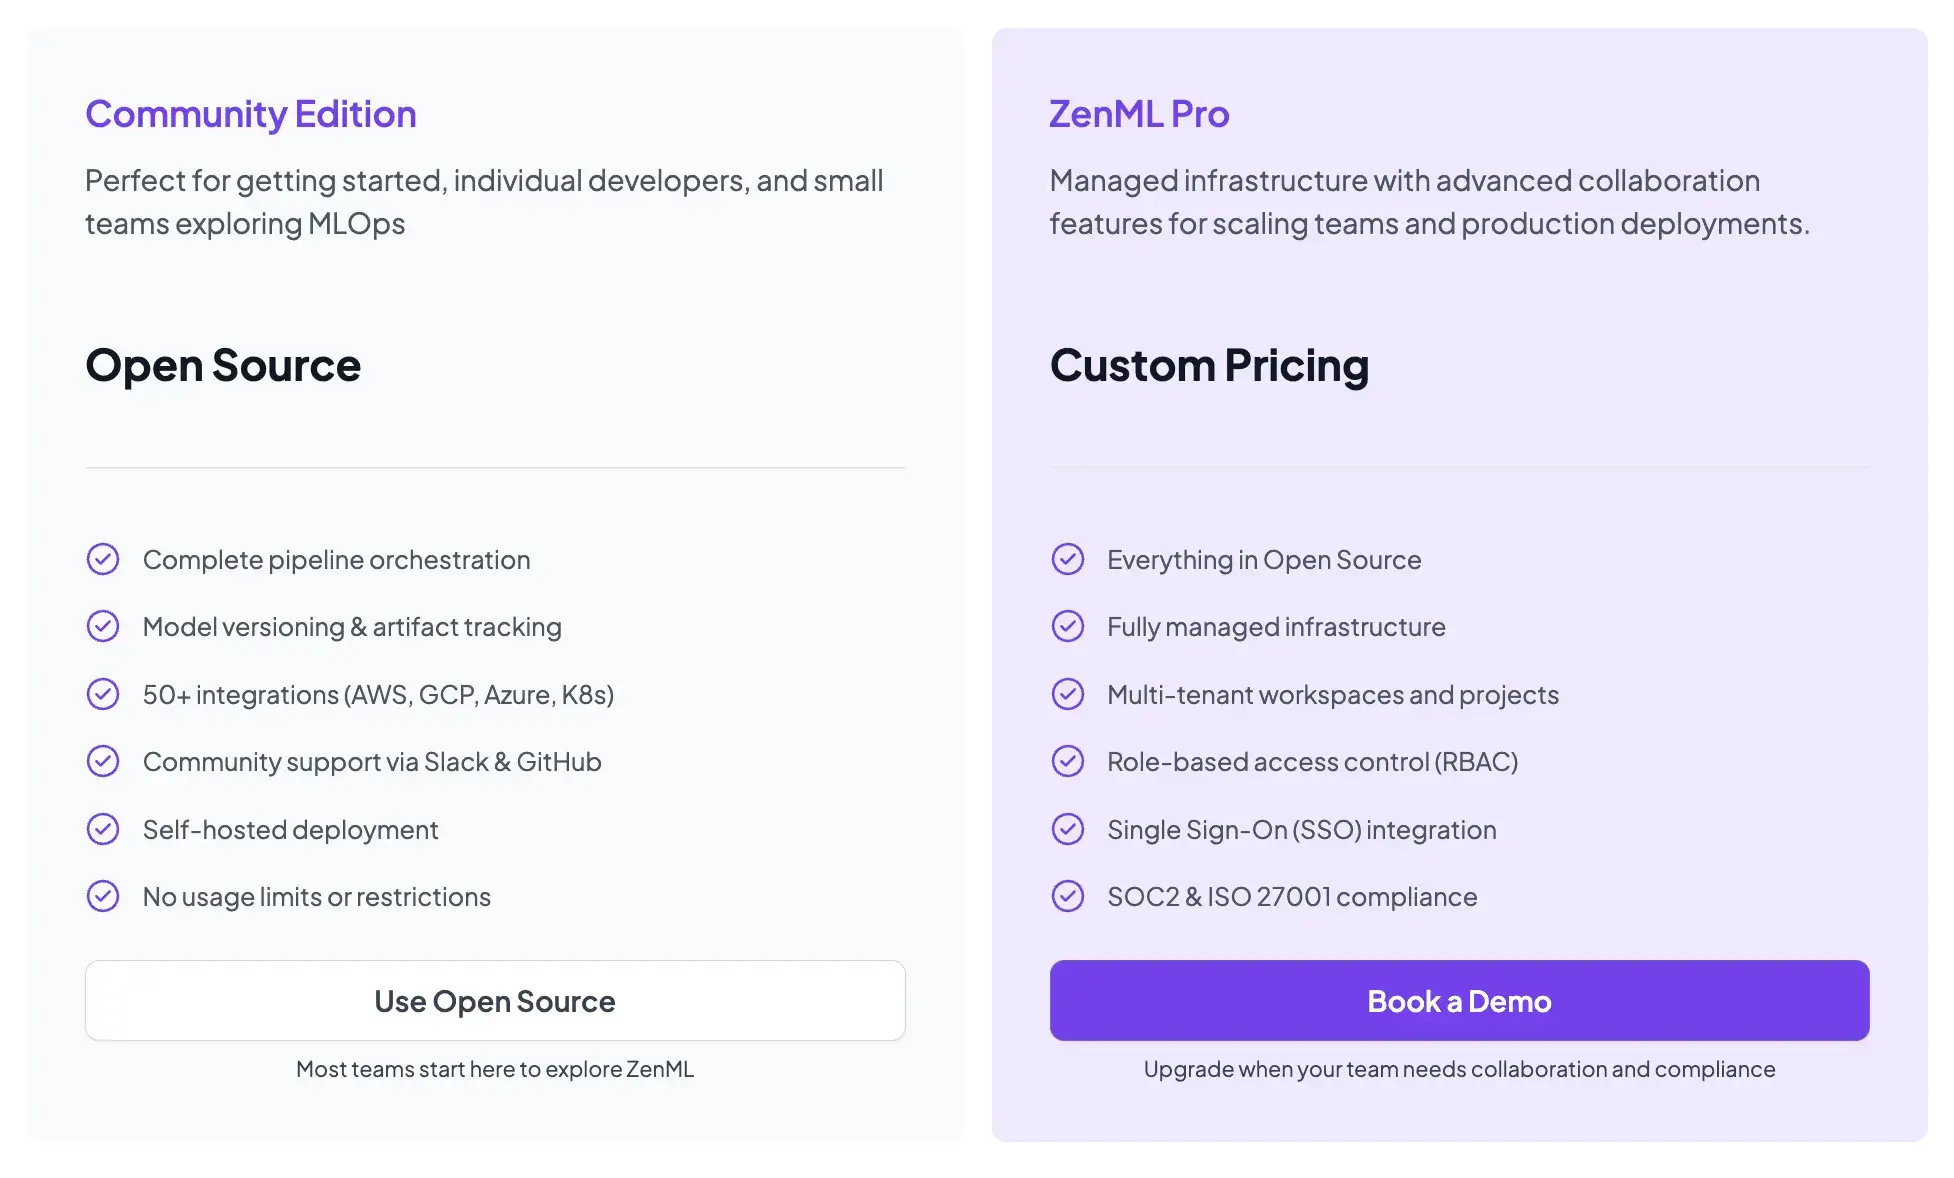
- Community (Free): Full open-source framework. You can run it on your own infrastructure for free.
- ZenML Pro (Custom pricing): A managed control plane that handles the dashboard, user management, and stack configurations. This removes the burden of hosting the ZenML server yourself.
📚 Relevant comparison to read:
Wrapping Up
MLRun, MLflow, and ZenML each address different MLOps needs. Choosing the right tool can be overwhelming, and so here’s a quick guide that will help you make a choice:
- Choose MLflow if you primarily need to track experiments and organize models. It is the best place to start if you just want to log metrics and don't care about pipeline automation yet.
- Choose MLRun if you are heavily invested in the Kubernetes/Iguazio ecosystem and want to automate operational tasks like building containers and deploying serverless functions.
- Choose ZenML if you want a unifying MLOps framework. You want to build reproducible pipelines that can run anywhere and glue your existing tools like MLflow and Airflow into a coherent, production-grade workflow.

