On this page
The real struggle for ML teams isn’t coming up with modeling ideas. It’s producing evidence you can trust.
Which run produced this model? Which dataset version was used? Which prompt chain caused hallucinations in production? Which chain broke the evaluation quality? And the list goes on…
That is why Comet and MLflow show up in almost every ‘What should we standardize on?’ platform discussions. Both give you an experimental system of record. They differ in how opinionated they are, how much they bundle, and how you run them.
ZenML fits into this Comet vs MLflow comparison because it solves an important problem that experiment trackers don’t: turning ad-hoc scripts into reproducible, step-based pipelines with artifact lineage as a default outcome.
Comet vs MLflow vs ZenML: Key Takeaways
🧑💻 Comet: Organizes ML work in a hierarchy that maps well to real teams: organizations, workspaces, projects, and experiments. It also makes a clear distinction between metadata, assets, and artifacts, which affects how you design reproducibility and lineage.
🧑💻 MLflow: Widely adopted tracking layer with a simple API and UI for parameters, code, versions, metrics, and output files. It supports several languages and is designed to work both locally and in a team setting when deployed with a tracking server.
🧑💻 ZenML: Treats a pipeline run as the unit of execution and record. It automatically stores step outputs as artifacts and tracks relationships between steps and artifacts to build lineage. When you still want a run-centric tracking UI, ZenML provides experiment tracker stack components that connect to Comet or MLflow and establish an explicit link between the pipeline runs and tracker runs.
Comet vs MLflow vs ZenML: Features Comparison
Here are the differences between Comet, MLflow, and ZenML in a nutshell:
<tr>
  <td><strong>Experiment Tracking</strong></td>
  <td>
    Run-centric tracking with strong UI, experiment comparison, and structured separation between metadata, assets, and artifacts
  </td>
  <td>
    Lightweight run-based tracking with autologging, parent-child runs, and broad ecosystem adoption
  </td>
  <td>
    Pipeline-run centric tracking with automatic step artifacts and optional integration with Comet or MLflow
  </td>
</tr>

<tr>
  <td><strong>Artifact Management and Lineage</strong></td>
  <td>
    Versioned artifacts with experiment-level lineage and remote artifact support
  </td>
  <td>
    Separate backend + artifact store, Model Registry with model version governance
  </td>
  <td>
    Automatic step-level artifact versioning with built-in end-to-end pipeline lineage
  </td>
</tr>

<tr>
  <td><strong>LLM Tracing and Observability</strong></td>
  <td>
    Opik provides trace + span-based LLM observability with evaluation tooling
  </td>
  <td>
    Native GenAI tracing built on OpenTelemetry, self-hosted and extensible
  </td>
  <td>
    Not request-level tracing; focuses on reproducible LLM pipelines with OTEL-based logging support
  </td>
</tr>

<tr>
  <td><strong>Integrations</strong></td>
  <td>
    Vertical MLOps platform with built-in tooling and framework integrations
  </td>
  <td>
    Wide ML library and cloud integrations (Databricks, SageMaker, etc.)
  </td>
  <td>
    Stack-based architecture integrating 50+ MLOps tools, including MLflow and Comet
  </td>
</tr>| Feature | Comet | MLflow | ZenML |
|---|
Feature 1. Experiment Tracking
Experiment tracking is where most teams start. This is the system of record for runs, parameters, metrics, artifacts, and comparisons.
Comet
Comet defines a training run as an experiment and lets you log three broad categories of information: metadata, assets, and artifacts. That taxonomy matters in practice because assets are commonly used for “one-off” files like plots or confusion metrics, while artifacts are meant to be versioned and reused across experiments.
At the SDK level, the Comet Experiment object represents a single measurable execution of code, and Comet supports creating multiple experiment objects in one script for cases like hyperparameter loops.
Comet’s logging API separates metrics and parameters into dedicated methods, which include log_metric, log_metrics, log_parameter, and log_parameters. It also supports UI panels like line charts and parallel coordinates charts, so you can visualize your runs.
On the UI side, the ‘single experiment’ page exposes automatically logged and custom metrics, code, logs, text, images, and audio. Comet also surfaces domain-specific tooling, like a confusion matrix view, when relevant artifacts are logged that way. What’s more, the framework supports experiment comparison directly in the UI.
MLflow
MLflow Tracking is explicitly positioned as an API and UI to log parameters, code versions, metrics, and output files, and then visualize the outputs in the tracking UI. It supports Python APIs, REST, R, and Java.
MLflow’s tracking conceptual model revolves around runs and experiments. A run represents a single execution, and an experiment group runs for a task. Runs can record metadata and artifacts like model weights or images.
Where MLflow usually wins mindshare is its simplicity and ecosystem defaults. You can log manually with mlflow.start_run, mlflow.log_param, and mlflow.log_metric, or enable autologging by calling mlflow.autolog() before training code.
Autologging can capture metrics, parameters, artifacts like checkpoints, and even dataset objects where applicable.
MLflow provides search and filtering of runs via the UI and Python API, including filtering by metrics, params, tags, and dataset information.
For run grouping, it supports parent and child runs as a way to organise many hyperparameter trials under a parent structure.
ZenML
ZenML approaches experiment tracking from the pipeline side. In ZenML, each pipeline run counts as an experiment, and ZenML can persist experiment results using components of the experiment tracker stack. This design creates a link between pipeline runs and experiments in an external tracker.
Even without its own external tracker, ZenML’s core system gives you a strong run context:
- Every step output becomes an artifact automatically.
- ZenML tracks relationships between steps and artifacts to build lineage.
- You can attach structured metadata to steps, pipeline runs, artifacts, and models, and ZenML visualises it in the dashboard.
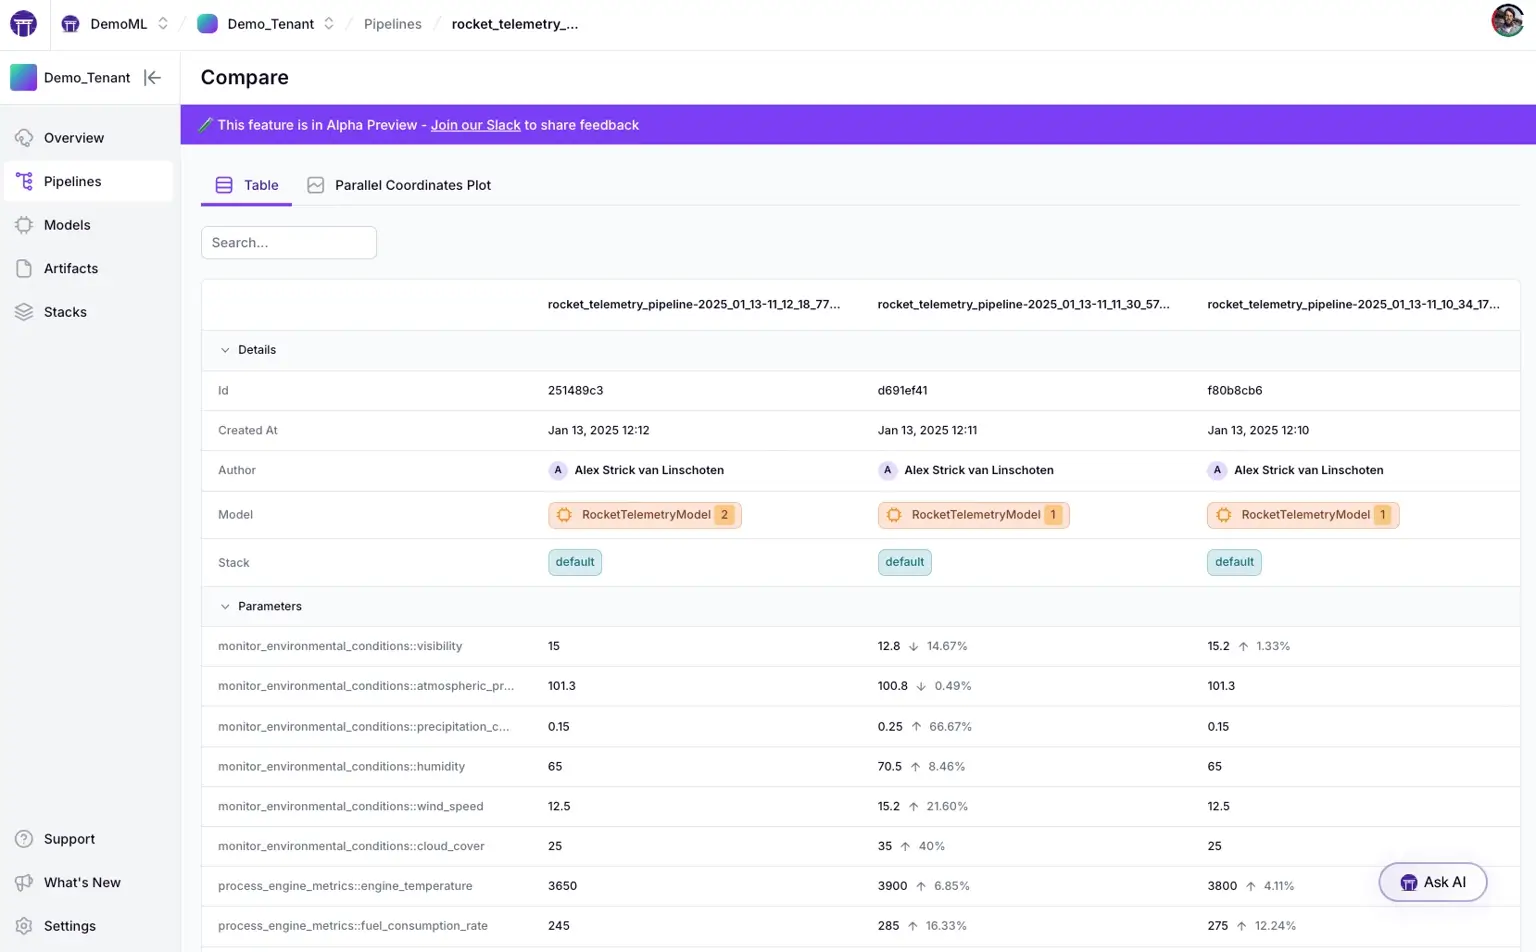
ZenML also has a Pro-tier ‘experiment comparison’ tool focused on pipeline-run analysis. It can compare up to 20 pipeline runs at once and analyze any numerical metadata your pipelines generate.
ZenML integrates with CometML and MLflow so you can log and visualize pipeline runs in the tracker UI when your team wants run-centric comparisons.
Bottom line: If your team wants the cleanest run-centric UI for comparing experiments, Comet is the most “productized” experience; if you want the simplest, most widely adopted open tracking layer, MLflow wins; if your “experiments” are really pipeline runs with step outputs you need to preserve and reproduce, ZenML is the most practical foundation; and you can still plug Comet/MLflow on top for run-level dashboards in ZenML.
Feature 2. Artifact Management and Lineage
Artifacts determine whether your ML system is reproducible or just logged. Let’s see how each platform approached artifact management and lineage.
Comet
Comet Artifacts are a dedicated versioning mechanism. According to Comet, an artifact is a versioned object where each version is an immutable snapshot of files and assets in a folder-like structure. Each snapshot can include metadata, tags, and aliases.
Comet also claims explicit lineage at the artifact layer: an artifact tracks which experiments consumed it and which experiment produced it. That answers lineage questions when you treat datasets and other inputs as artifacts, then link them through experiment usage.
The framework also provides remote artifacts for cases where you want lineage but don’t want to upload the underlying data into Comet.
For ‘code-to-result traceability,’ Comet supports code logging. Unless disabled, Comet automatically logs the file that created the experiment and relevant Git information, including commit and uncommitted-file path data. It also supports comparing code used across runs via experiment comparison.
MLflow
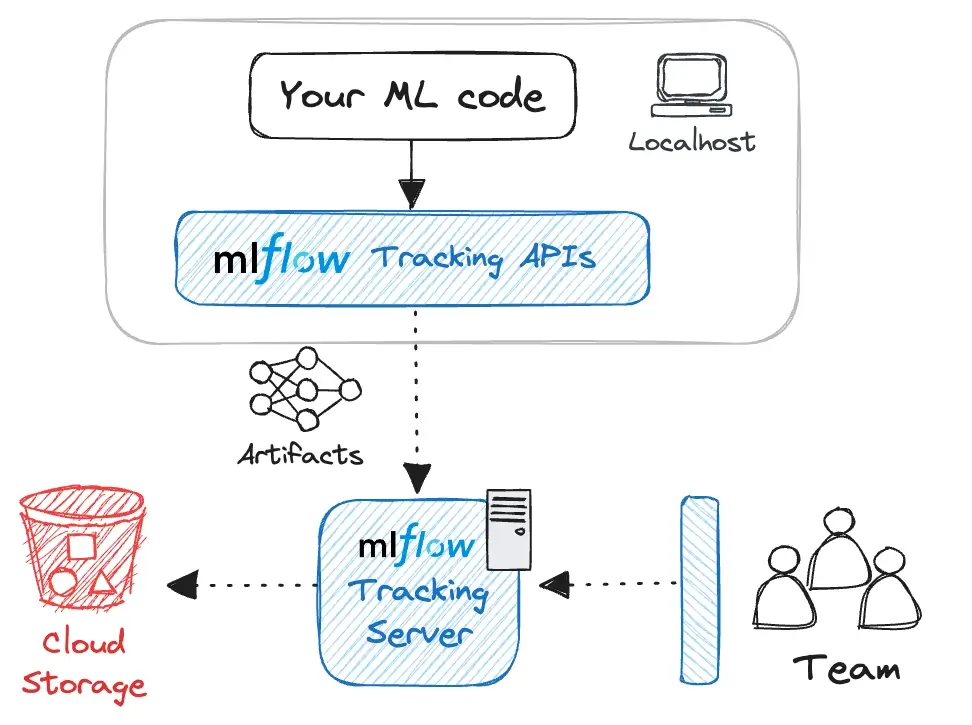
MLflow’s architecture explicitly separates metadata storage from file storage. The backend store holds metadata like run IDs, tags, parameters, and metrics. The artifact store holds large artifacts - model weights, images, and data files.
For team usage and remote storage, MLflow can be deployed with a tracking server. MLflow’s self-hosting docs describe the higher-level architecture in terms of a tracking server, backend store, and artifact store.
MLflow’s Model Registry adds a lifecycle layer on top of experiment tracking. Each registered model version is traceable back to the exact run or notebook that produced it, giving teams structured lineage and governance. With model version aliases (for example, a champion alias), teams can point production consumers at a stable reference and promote a new model by reassigning the alias to a different model version, without changing downstream code.
For dataset lineage, MLflow’s dataset tracking uses the mlflow.data module. It is a dataset management feature that can track and version datasets used in training, validation, and evaluation, with lineage from raw data to model predictions.
ZenML
ZenML’s artifact model is pipeline-native: if a step returns a value, ZenML stores it as an artifact automatically, and other steps can consume that artifact. ZenML tracks the relationships between steps and artifacts. ZenML describes this as complete data lineage for every artifact and explicitly frames it as enabling reproducibility and traceability.
ZenML approaches experiment tracking from a pipeline-first perspective. Every pipeline run produces versioned artifacts stored in its mandatory artifact store, which creates built-in traceability by default.
Experiment trackers then layer on usability, offering an interactive UI to browse runs, compare results, and visualize metrics without changing how artifacts are managed underneath.
This distinction is often where ZenML fits best:
- Use ZenML artifacts and lineage for pipeline-level traceability across preprocessing, training, evaluation, and deployment steps.
- Use Comet or MLflow integrations with ZenML as the external UI layer if your team wants to run tables, detailed metric charts, and model-centric comparison workflows.
Bottom line: ZenML is the clear winner when lineage and reproducibility are non-negotiable: artifact versioning and end-to-end lineage happen by default at the step level because every pipeline step output becomes a tracked artifact with relationships preserved automatically. Comet and MLflow can do strong lineage, but ZenML makes it the default outcome rather than an opt-in discipline.
Feature 3. LLM Tracing and Observability
As teams move into GenAI systems, tracing becomes more than logging metrics. Comet and MLflow focus on runtime observability, while ZenML focuses on workflow reproducibility.
Comet
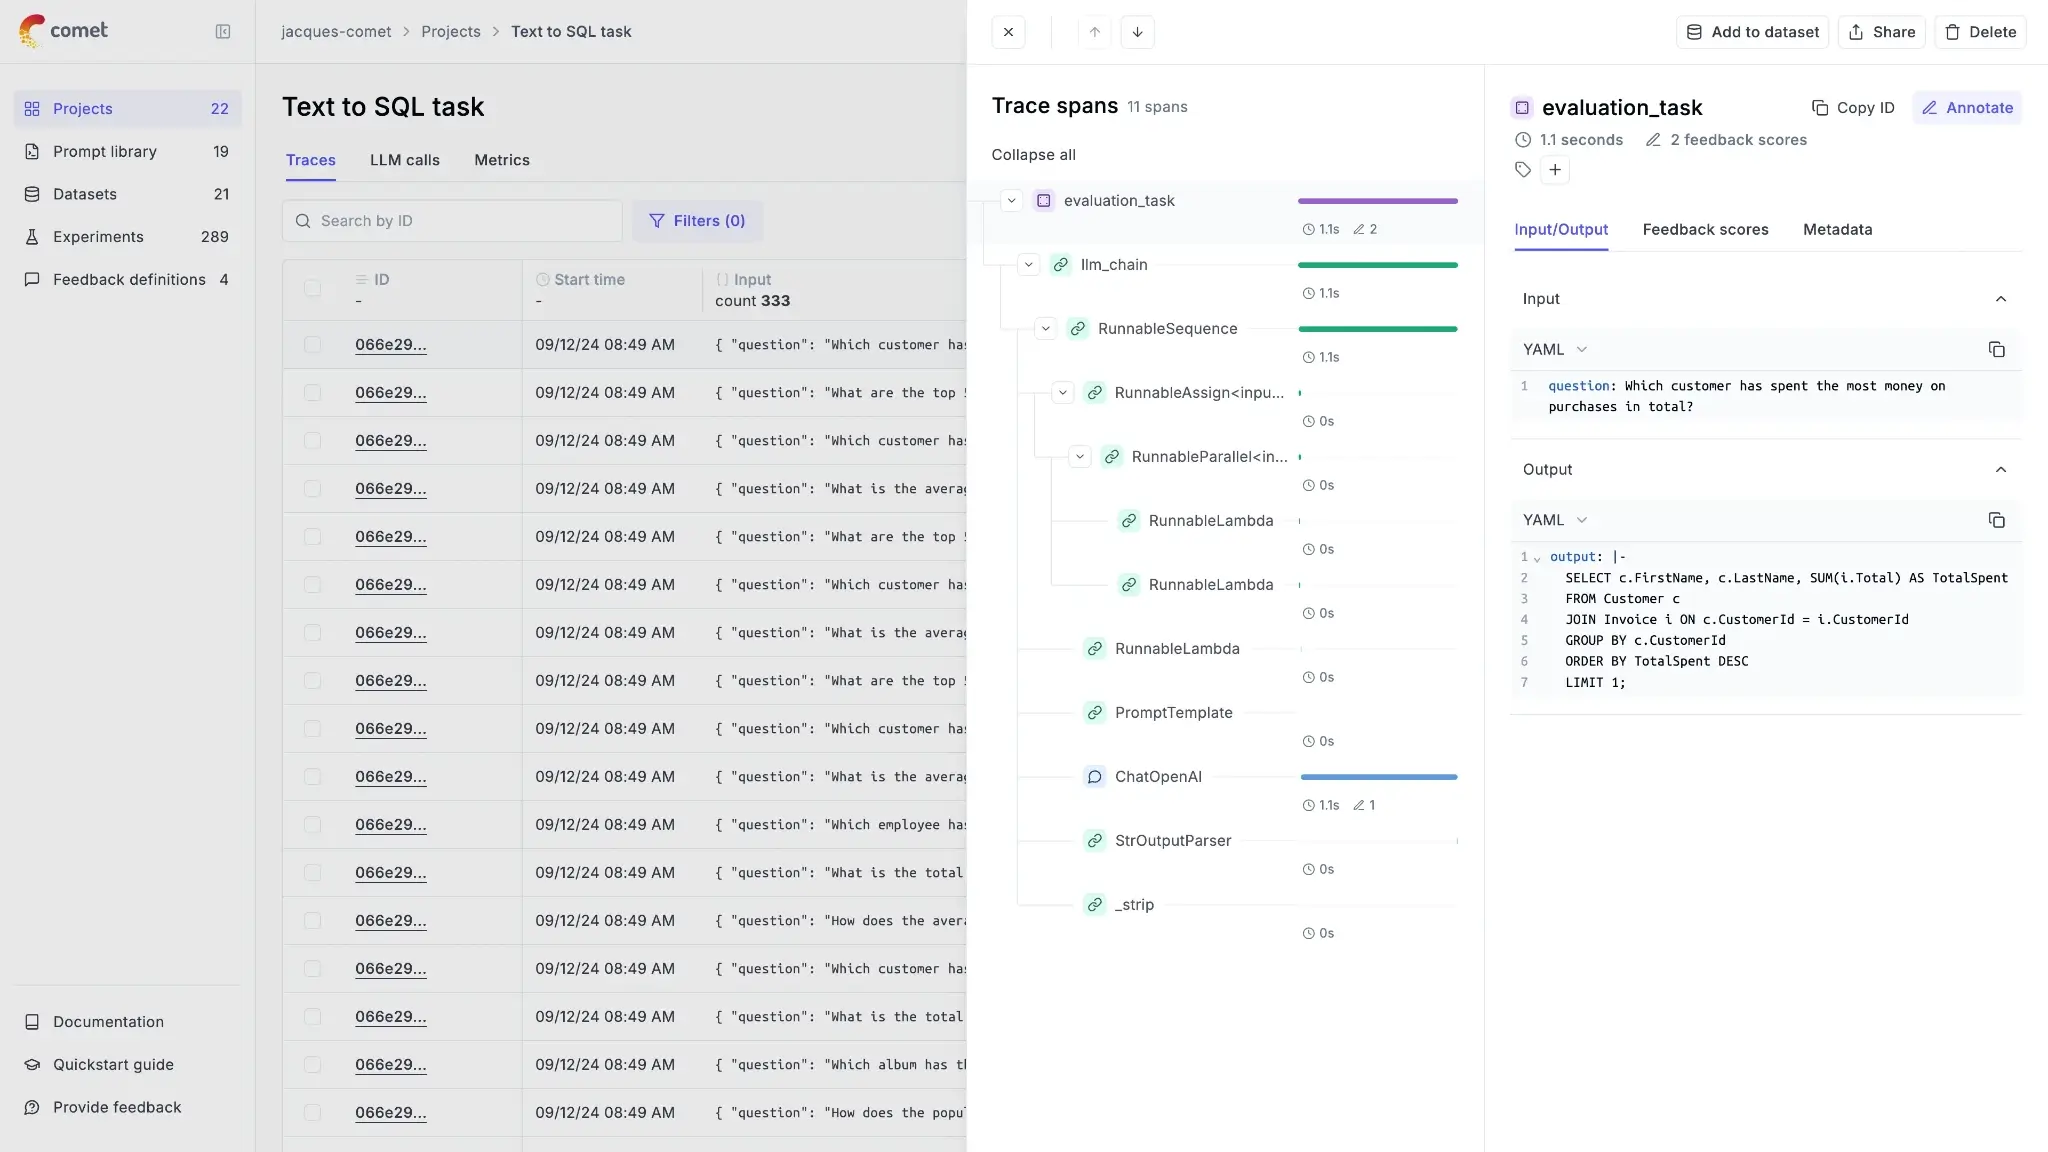
Comet’s LLM observability product is Opik. Opik’s tracing concepts define a trace as a complete execution path for one interaction, and spans as the operations within that trace. Traces capture inputs, outputs, timing, intermediate steps, and metadata like model configuration.
For Comet Opik, tracing is actually a way to capture not only LLM calls but also other steps, like retrieval and post-processing. Opik also has multiple instrumentation options: TypeScript SDK, Python SDK, OpenTelemetry support, and a REST API.
For framework integrations, Opik provides a LangChain integration via an OpikTracer callback. It can capture inputs, outputs, metadata, and cost tracking for each step in a chain.
For evaluation, it supports ‘task span metrics,’ which can access the full execution context rather than only input-output pairs. The Opik docs list intermediate steps, metadata, timing, and hierarchical structure as part of what task span metrics can evaluate.
MLflow
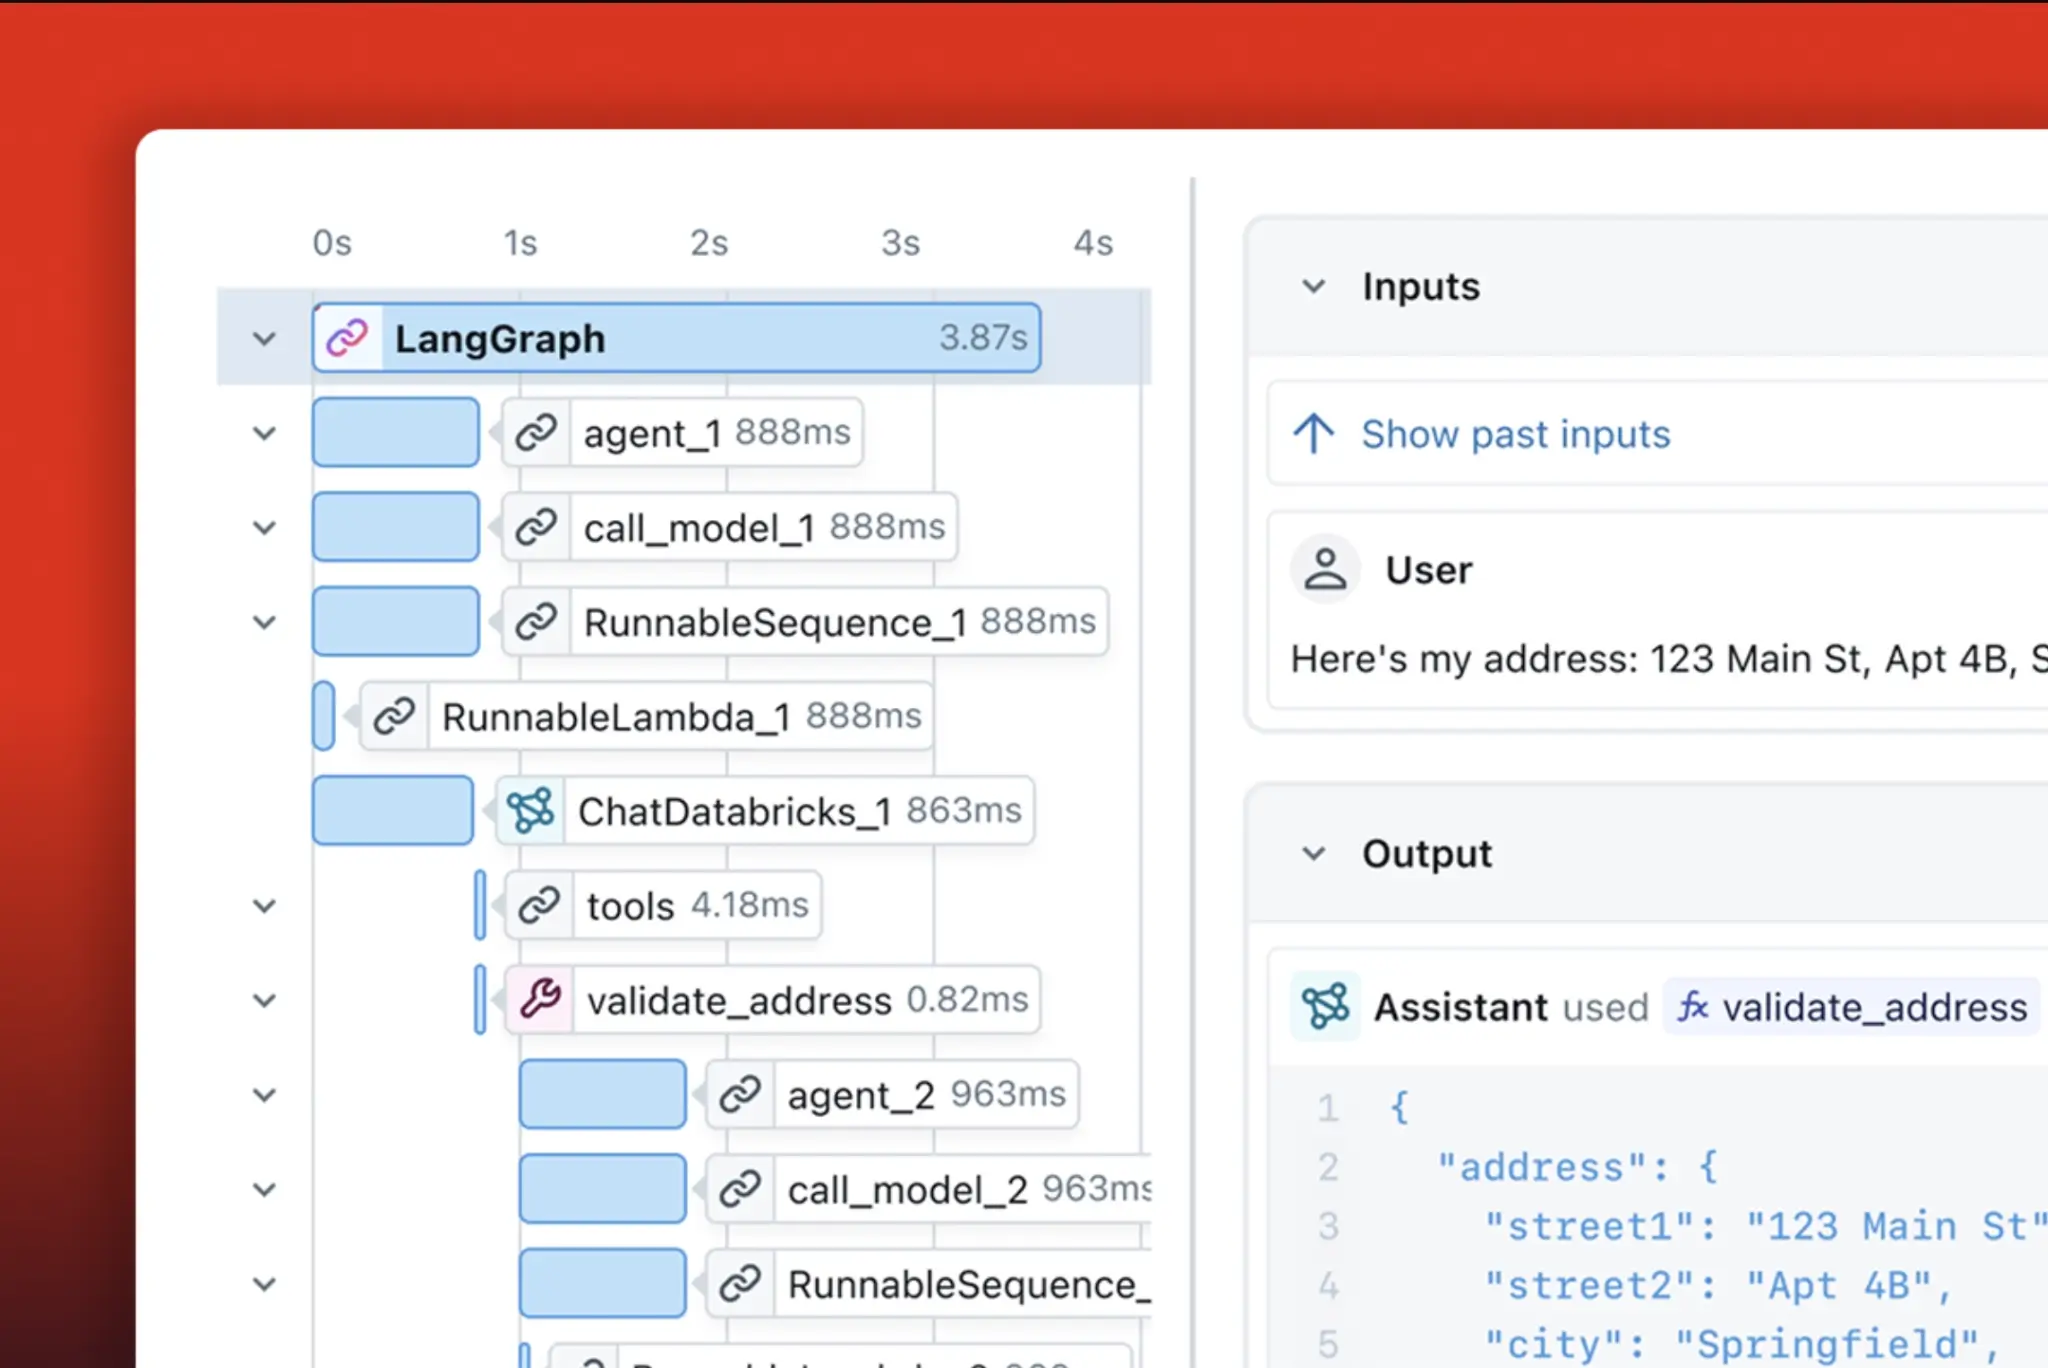
MLflow has a dedicated GenAI tracing feature set built on OpenTelemetry, and it supports self-hosted deployments where trace data lives in your infrastructure.
MLflow’s traces are critical for complex multi-step GenAI workflows and can be used for use cases like debugging, quality checks, including attaching feedback, production monitoring, and dataset collection from production traces.
At the data model level, spans are the building blocks. Spans are containers for steps like LLM calls, tool execution, and retrieval operations.
On the OpenTelemetry side, MLflow tracing SDK is built on top of OpenTelemetry, and the MLflow server exposes an OTLP endpoint at /v1/traces to accept traces from OpenTelemetry-instrumented applications, including apps written in other languages.
ZenML
ZenML is not positioned as an LLM request tracing system in the way Opik and MLflow Tracing are. ZenML’s strength is that it can make LLM workflows reproducible as pipelines, and it can store outputs and evaluation artifacts as first-class pipeline artifacts, then connect those to real run records and metadata.
What ZenML does provide in this area is a log store abstraction that controls where pipeline and step logs are persisted.
ZenML includes a Log Store stack component that controls where pipeline and step logs are persisted (e.g., Artifact Store, OpenTelemetry, or Datadog).
If your platform uses OpenTelemetry as the standard signal format, it can matter that OpenTelemetry logs are a defined signal type in the OpenTelemetry specs, with standard APIs and SDKs for producing log records. ZenML’s OTEL log store flavour fits into that ecosystem for logs, but that does not replace LLM request tracing.
Bottom line: For true request-level tracing of LLM apps (traces/spans, debugging production interactions), Comet (Opik) and MLflow Tracing are the right tools; ZenML is not trying to replace them. ZenML’s advantage is upstream: it makes LLM workflows reproducible as pipelines and stores outputs/evals as first-class artifacts; then you pair it with Opik/MLflow Tracing when you need runtime observability.
Comet vs MLflow vs ZenML: Integration Capabilities
Integration determines whether a tool becomes your ecosystem hub or just another component.
Comet
Comet is a commercial experiment management platform that bundles experiment tracking with adjacent capabilities like dataset management/versioning, a model registry, and hyperparameter search. It’s typically used alongside your existing compute and orchestration setup, rather than replacing a workflow orchestrator.
While it integrates with many frameworks like PyTorch and TensorFlow, it encourages a vertical stack where Comet handles the bulk of the research lifecycle.
MLflow
MLflow’s integration story is split across two major domains:
- For model training, MLflow supports manual logging and offers autologging for many popular ML libraries. The platform integrates with MLOps tools like Keras or TensorFlow, LightGBM, PyTorch, scikit-learn, Spark, and XGBoost, and more.
- For GenAI, MLflow offers ‘one-line auto tracing’ integrations, and MLflow lists integrations across many GenAI libraries.
ZenML
ZenML’s integration model is the ‘stack.’ It’s designed to connect to many third-party tools once your code is organised into a pipeline. Our framework ships dedicated experiment tracker stack component integrations for both Comet and MLflow.
The MLflow experiment tracker integration supports multiple deployment scenarios, including a remote MLflow tracking server and a Databricks-managed MLflow server.
The Comet experiment tracker integration lets you enable the experiment tracker in a single step, log as usual, and then use the Comet UI to inspect experiments.
Apart from MLflow and Comet, there is a whole list of MLOps tools that ZenML integrates with. To name a few:
- Orchestrators: Airflow, Kubeflow, AWS Step Functions, local execution
- Metadata stores: SQLite, PostgreSQL, MySQL
- Artifact stores: Amazon S3, Google Cloud Storage, Azure Blob, local files
- Experiment trackers: MLflow, Weights & Biases, Comet
Comet vs MLflow vs ZenML: Pricing
Comet
Comet offers two flagship product families - Opik and MLOps, with different use cases and pricing.
- Opik: Comet’s GenAI / LLM observability and evaluation product. It’s meant for LLM apps and agents (trace, evaluate, debug, iterate).
- MLOps (Experiment Management): Comet’s product for training ML models: experiment tracking, dataset management/versioning, model registry, and model production monitoring (enterprise).
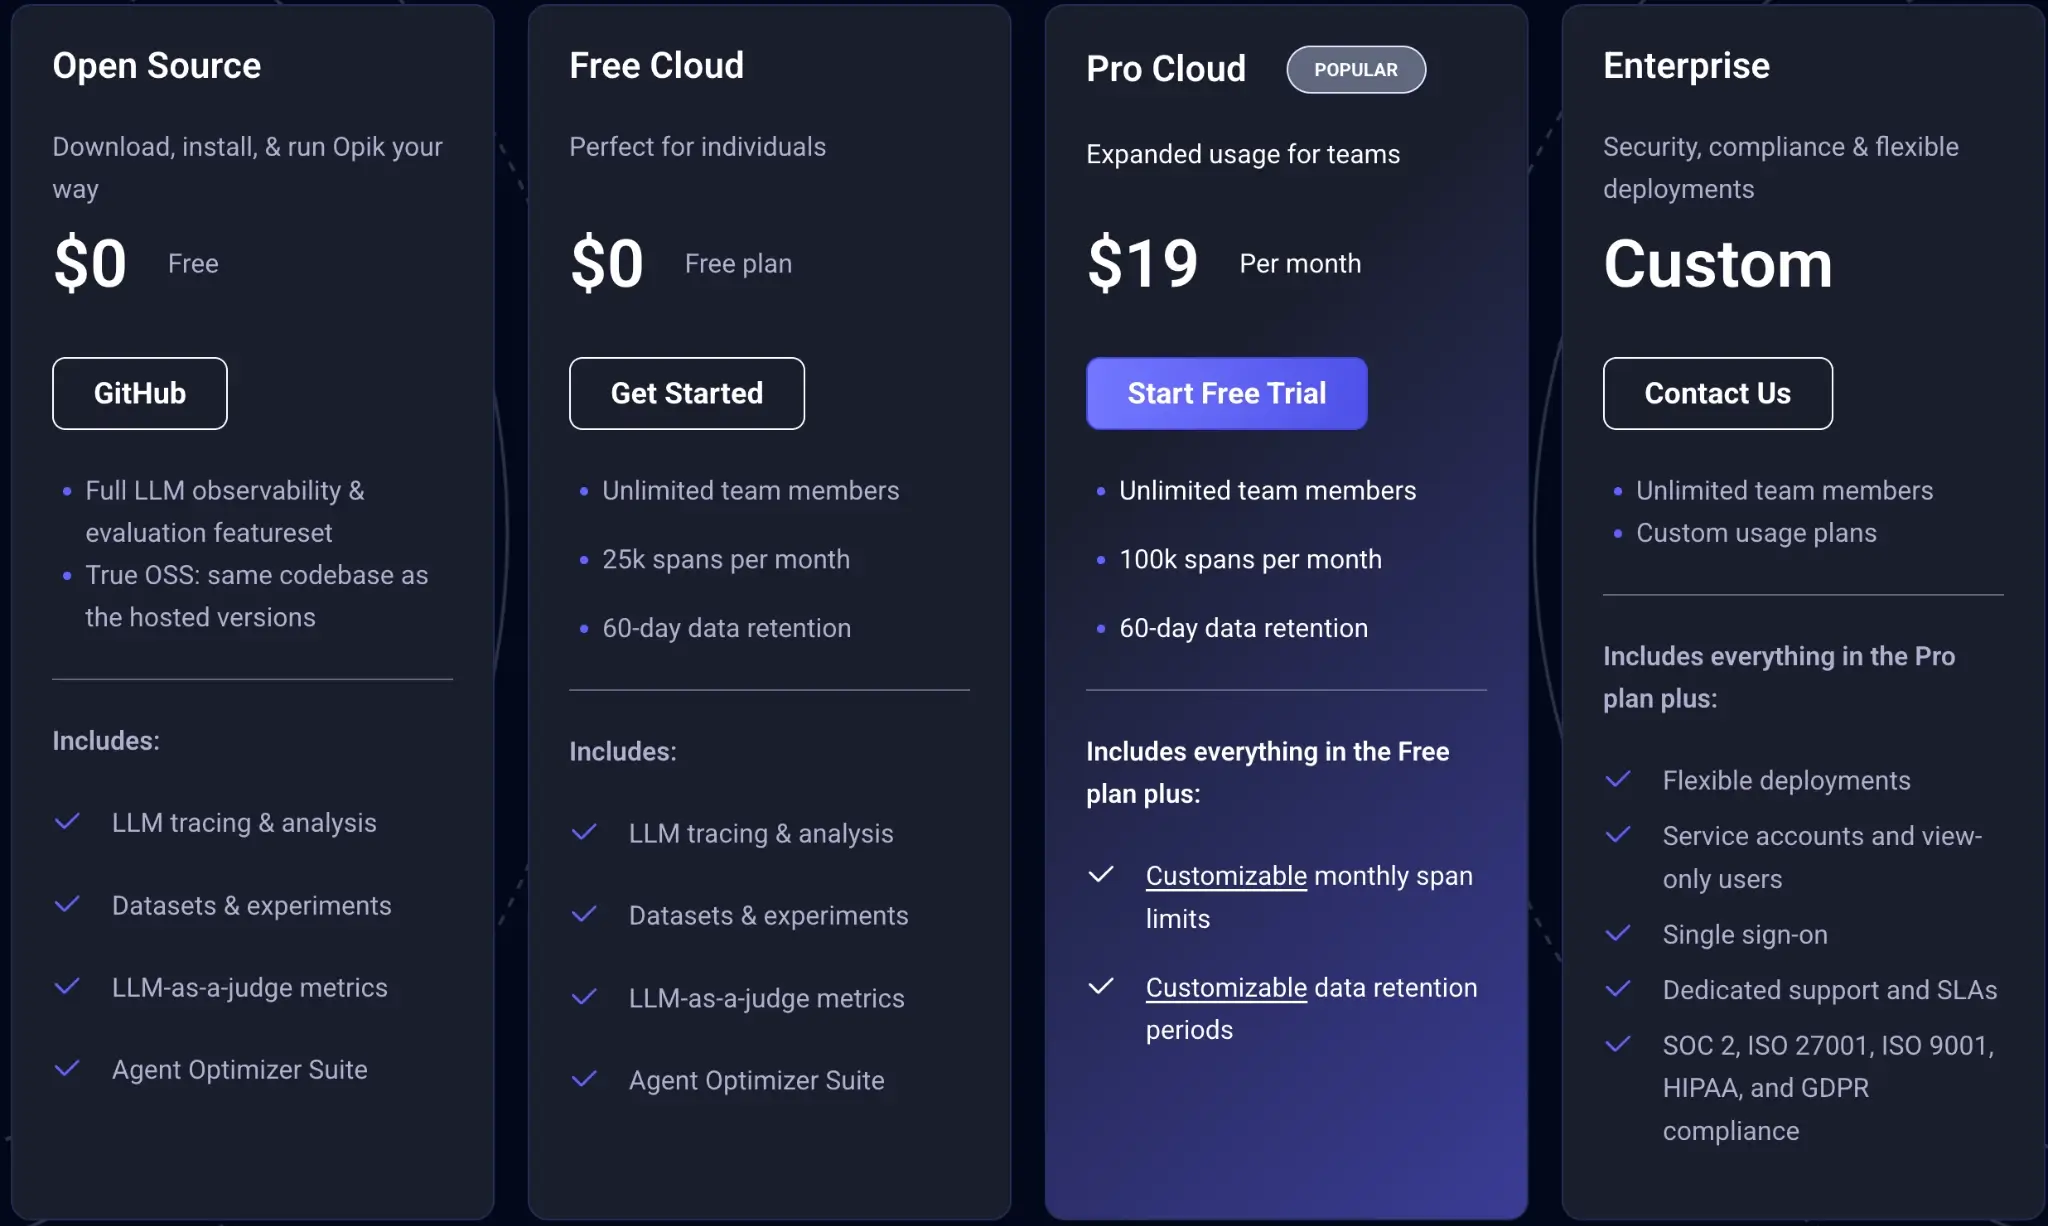
Comet Opik offers 4 plans to choose from:
- Open source
- Free Cloud
- Pro Cloud: $19 per month
- Enterprise: Custom
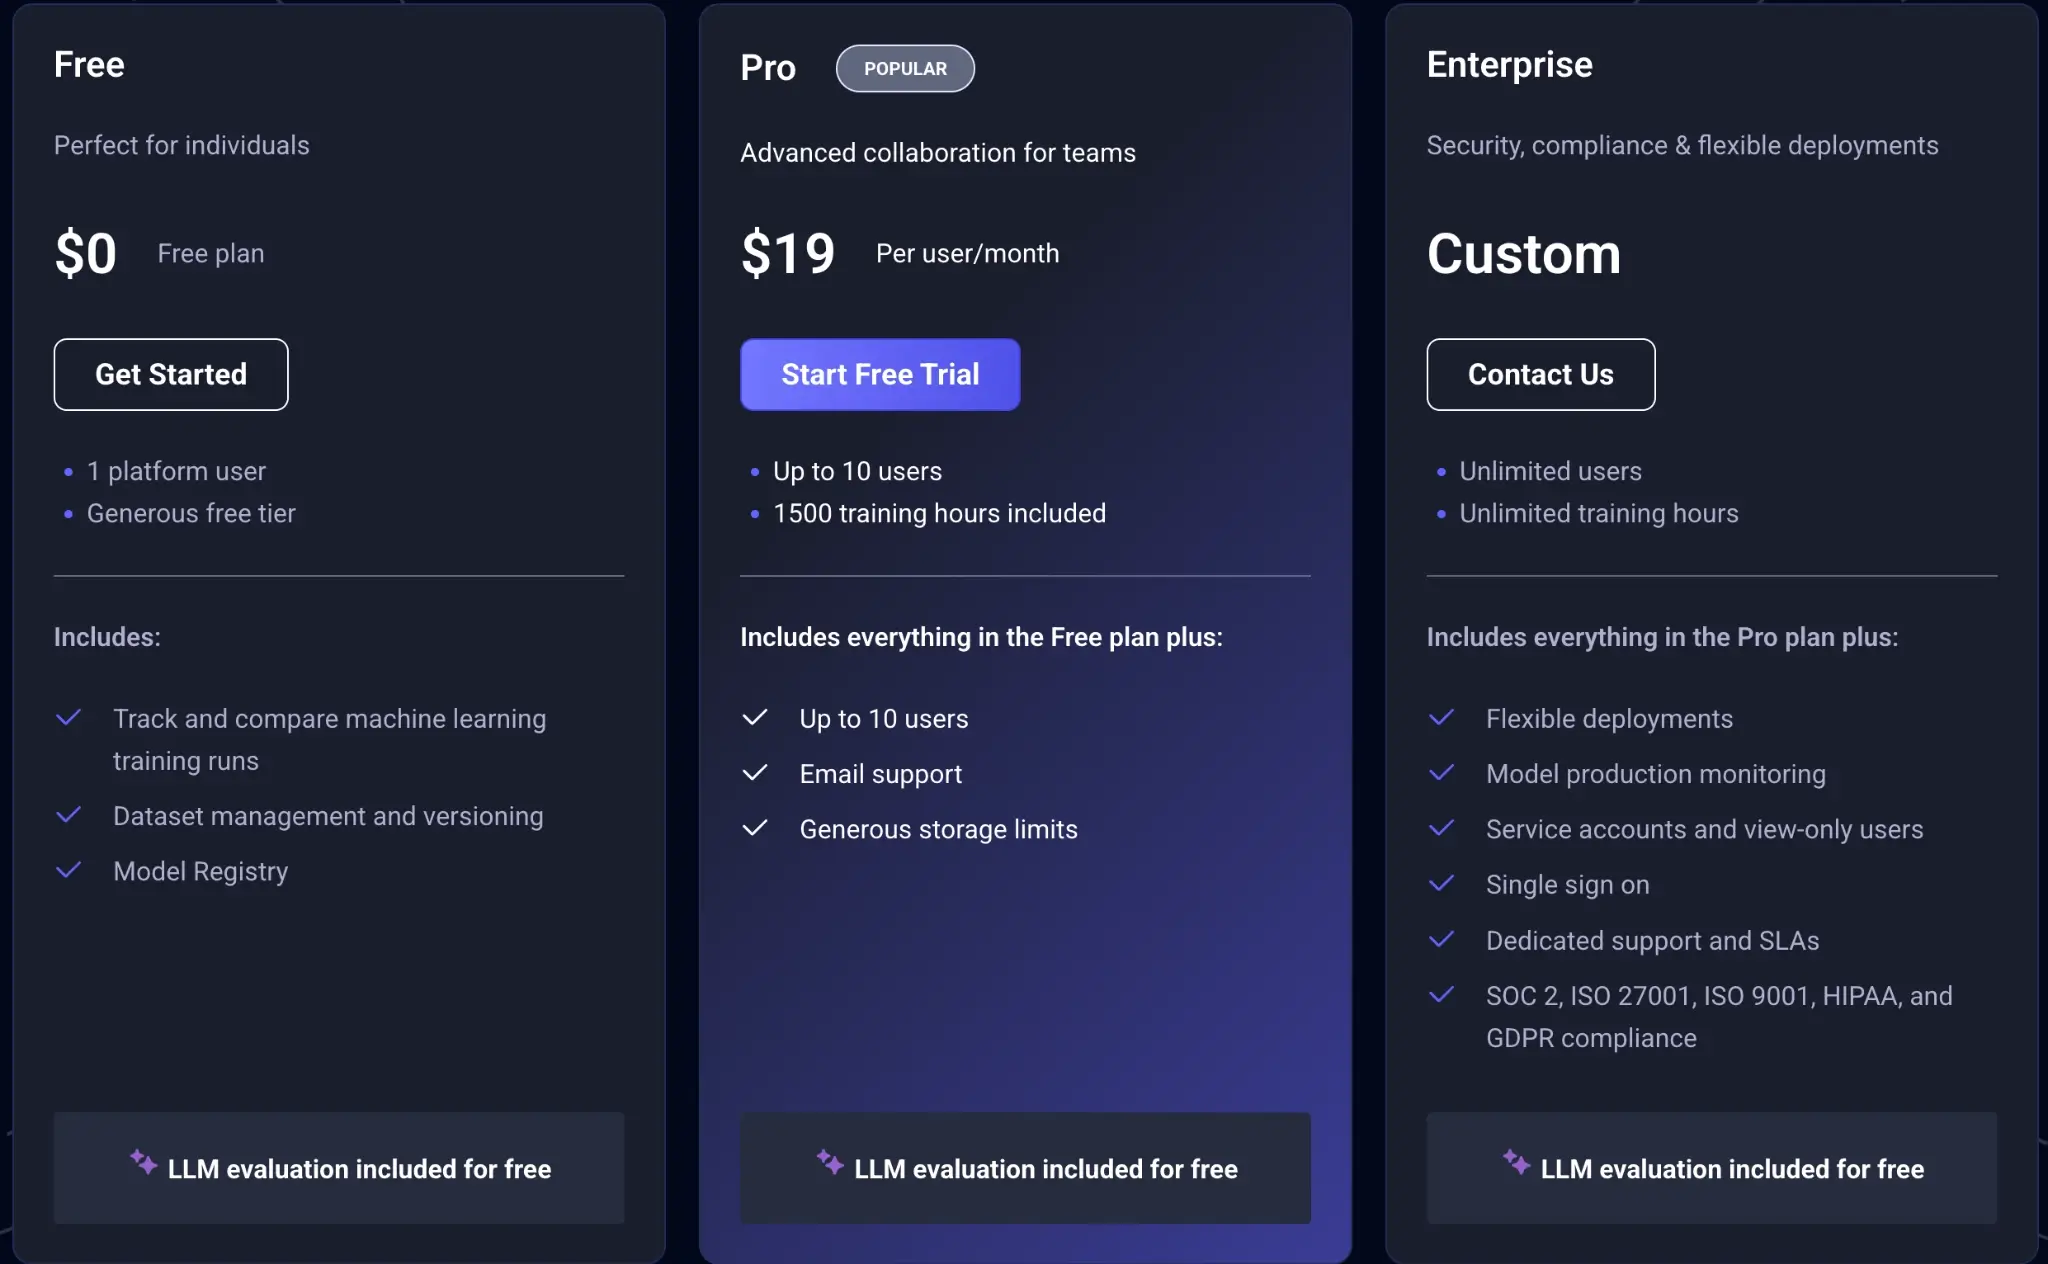
MLOps offers three plans to choose from:
- Free
- Pro: $19 per user per month
- Enterprise: Custom
MLflow
MLflow also offers an open-source version that can be self-hosted on various infrastructures.
Managed services:
- Databricks Managed MLflow: Integrated within the Databricks platform, pricing varies based on compute and storage usage.
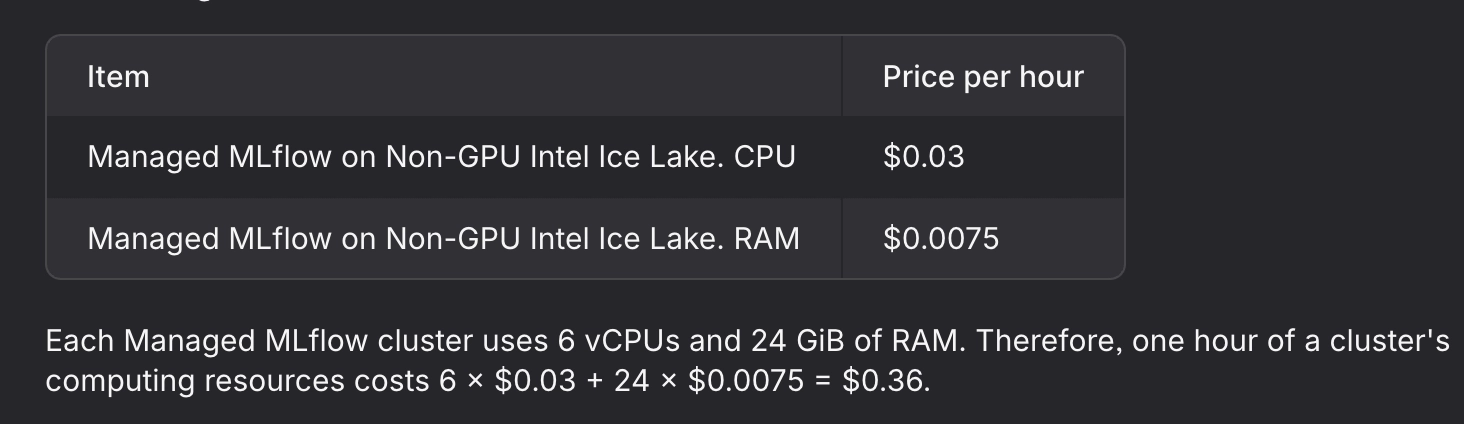
- Amazon SageMaker with MLflow: Amazon SageMaker AI provides a fully managed MLflow tracking server (MLflow 3.0). Pricing is based on the tracking server’s compute instance size and runtime, plus metadata storage. Artifact storage (e.g., model files) is billed separately in your own storage (such as Amazon S3). For current per-hour rates by instance size, refer to the SageMaker AI pricing page.
- Nebius Managed MLflow: Charges approximately $0.36/hour for a cluster with 6 vCPUs and 24 GiB RAM.
ZenML
ZenML is open source and can be self-hosted for free. In addition, ZenML offers managed plans (Starter, Growth, Scale) and an Enterprise tier for organizations that need advanced security, support, and deployment options.
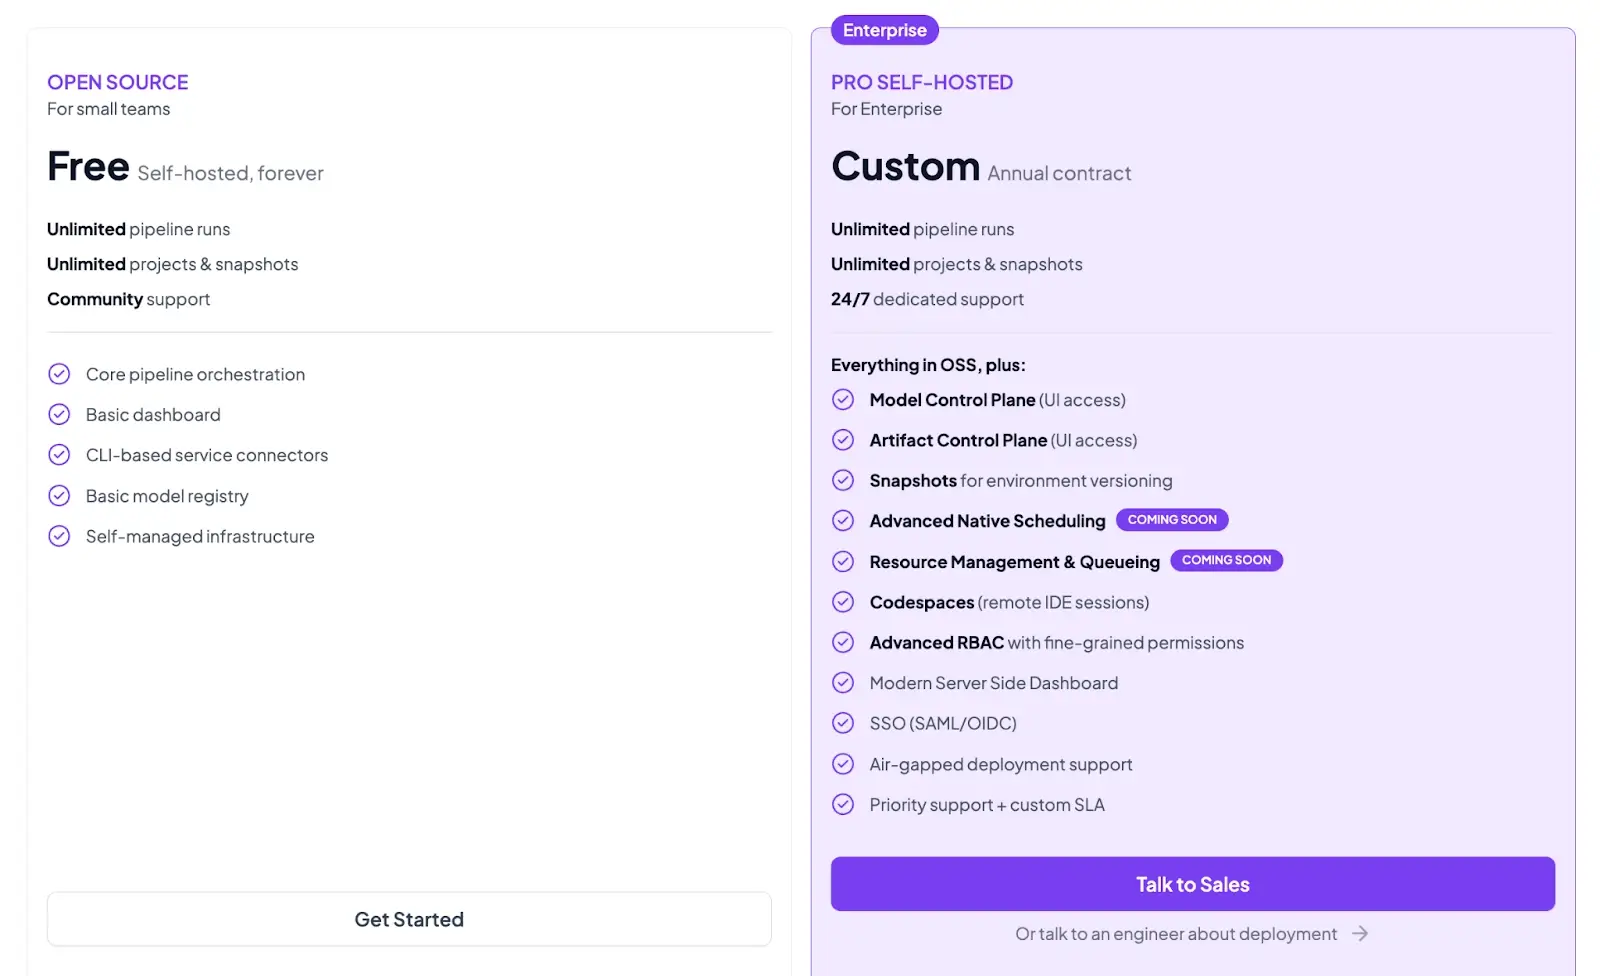
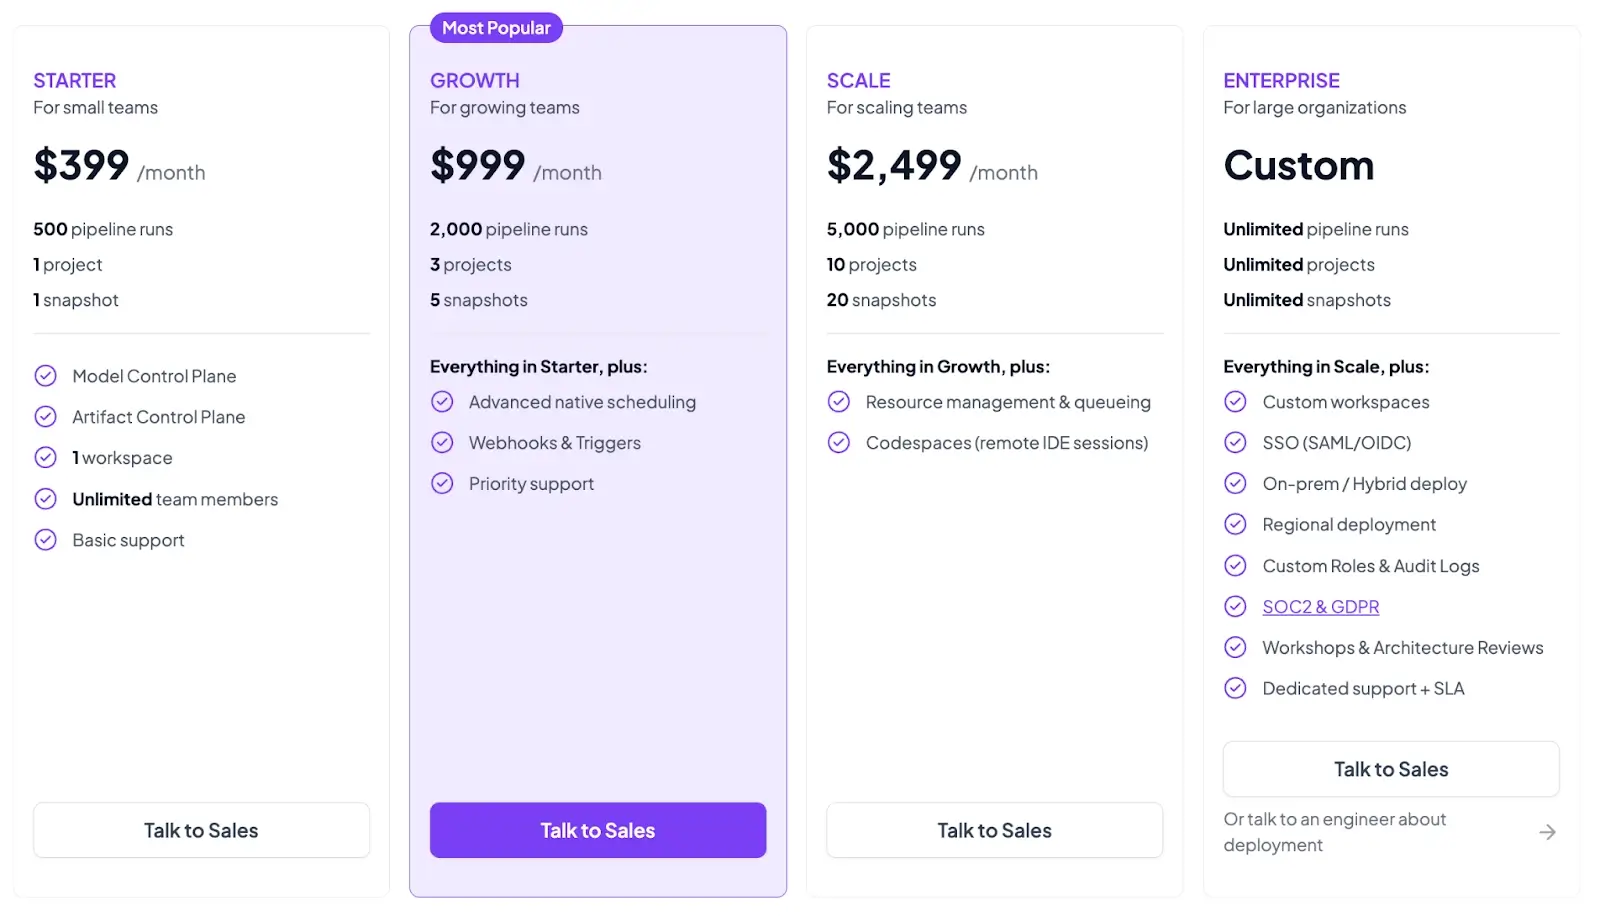
Both the plans above are self-hosted. ZenML now also has 4 paid SaaS plans:
- Starter: $399 per month
- Growth: $999 per month
- Scale: $2,499 per month
- Enterprise: Custom pricing
Wrapping Up Comet vs MLflow vs ZenML Comparison
If you are deciding between Comet, MLflow, and ZenML, you are usually deciding between different operational philosophies.
- Comet is a commercial platform with a strong focus on end-to-end experiment management UX. It gives you a structured hierarchy, a rich ‘single experiment’ view, and a strong artifact story with versioning, metadata, tags, aliases, and produced-by/consumed-by lineage.
- MLflow is an open-source standard layer for tracking the model lifecycle. It gives you simple logging APIs, autolog support, a storage architecture designed for a tracking server plus backend and artifact stores, and a model registry that connects model versions back to runs. For GenAI workloads, MLflow tracing delivers an OpenTelemetry-based approach with OTLP ingestion.
- ZenML fits when your real problem is not only tracking experiments, but also making the workflow reproducible as a pipeline. ZenML’s pipeline and artifact model creates lineage by default: step outputs become artifacts, ZenML stores them, and tracks relationships between steps and artifacts. You can then attach Comet or MLflow as an experiment tracker stack component when your team wants that run-centric UI and ecosystem tooling, with an explicit link between pipeline runs and tracker artifacts.