On this page
Cron expressions look simple. Five fields, maybe six. Run this pipeline every hour. Retrain this model nightly. What could go wrong?
A lot, as it turns out. After spending time looking at how production teams at Twitter, LinkedIn, Shopify, and Pinterest have approached scheduled ML workflows, I’ve come to appreciate just how much lurks beneath that innocent-looking 0 4 * * *.
This post walks through the hidden complexity of pipeline schedules and the design decisions that emerge when you try to build an abstraction layer on top of them.
The Freshness Problem: Twitter’s Proof That Cadence Matters
In 2018, Twitter’s Cortex team built ML Workflows on Airflow to replace the ad-hoc scripts teams were using to retrain models. Before the migration, retraining meant “manually triggering and waiting for a series of jobs to complete,” which added overhead and led to frequent errors. After: automated, scheduled pipelines that made it practical to retrain more often.
They tested whether faster retraining actually made a difference. It did. Shorter intervals delivered measurably better timeline quality.
What I take from this: operational friction quietly stretches retraining cycles, and that cadence can show up directly in user-facing quality. A schedule that actually runs beats a manual process that drifts. In my experience, however, plenty of teams are still running manual processes or ad-hoc scripts that “someone kicks off when they remember.”
Job Success ≠ Data Success: LinkedIn’s 1.5-Day Blind Spot
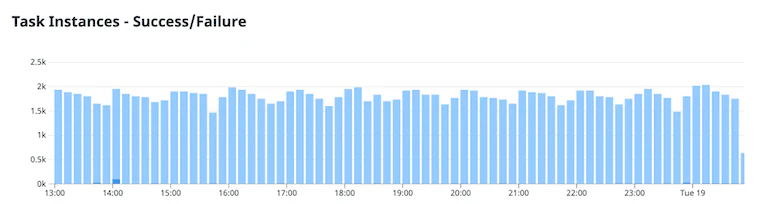
LinkedIn’s engineering team ran into a different problem after a Kafka ingestion migration. Their pipelines bootstrapped every topic from four days prior. The jobs completed successfully. Green icons in their monitoring dashboard.
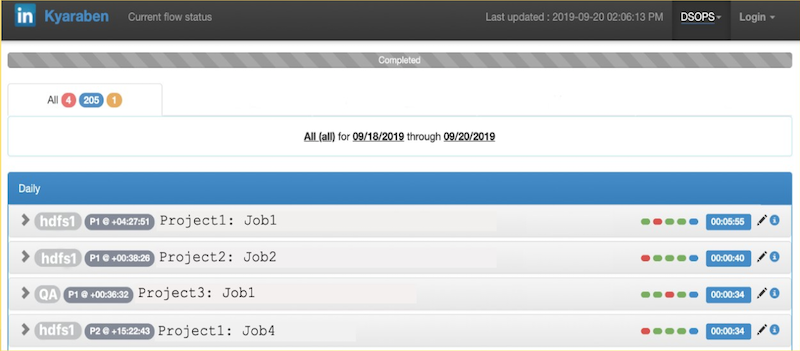
But the watermarks indicating ingestion progress had stopped moving entirely. Their monitoring was primarily focused on job pass/fail status, so they lacked the visibility to catch the bootstrap problem promptly.
They often didn’t notice until 1.5 days later, when downstream consumers began asking why their data was missing. They rolled back quickly, but given their consumption rates into HDFS, the ingestion took almost two weeks to catch up.
Their pipeline had become what they called a “black box.” They couldn’t answer basic questions: Did the job actually complete all tasks? Did some datasets fail to process? How long has the job not been processing any data?
What I take from this: job status is a scheduler metric, not a data product metric. Your pipeline can succeed technically while failing completely for the people who depend on its output.
LinkedIn’s solution combined job-level event monitoring with aggregated dataset-level metrics (ingestion lag, data loss, availability), plus alert correlation and auto-remediation. The broader point: they moved from asking “did the job run?” to asking “is the data where it should be?”
The Thundering Herd: Shopify’s Scheduling Surges
When you’re running 10,000+ DAGs and 150,000 runs per day, patterns emerge that you’d never see at smaller scale. Shopify noticed that DAG authors were clustering their cron schedules at “nice” times: midnight, top of the hour. They also found that using absolute intervals like timedelta(hours=1) caused problems—when someone merges a batch of auto-generated DAGs, all the runs start at once.
The result? Large traffic surges that could overload the Airflow scheduler and any external services those jobs were hitting (like their Trino cluster).
Their solution was to use deterministically randomized schedules for automatically generated DAGs—which represent the vast majority of their workflows. The system generates crontabs based on a hash of a constant seed like the DAG ID. The effect is that jobs spread out naturally (one might run at minute 14, another at minute 42), and the schedules are stable—the same DAG always lands at the same time.
The enemy here isn’t cron syntax. It’s synchronization. “Every hour” isn’t just a schedule—it’s a traffic pattern you’re committing to. And at scale, human bias toward readable times can impact SLOs and put uneven load on external systems.
The harder question: do you build staggering into the platform, or trust DAG authors to pick good times? Shopify chose the former for their auto-generated workflows.
Overrun Policies: What Happens When Runs Collide
What happens when yesterday’s pipeline is still running when today’s is due to start?
In my experience, most teams don’t have an explicit answer. They inherit whatever their orchestrator defaults to. But that default quietly defines your cost profile and your failure mode.
Pinterest’s internal workflow system (Pinball) included overrun handling as part of their scheduler design. The scheduler stores a schedule token containing metadata including an overrun policy. Example policies they describe:
- Abort the running workflow when a new run is due
- Start another workflow instance in parallel
- Delay the workflow start until the previous run finishes
Each of these has trade-offs worth considering. Aborting risks partial outputs. Parallel runs can create resource contention—for ML training jobs specifically, think GPU quota conflicts, duplicate writes to a model registry, or double-processing the same data window. Delaying preserves clean handoffs but compounds freshness lag if jobs keep overrunning.
What I take from this: overrun policy isn’t an edge case. It’s a design decision you’re making whether you realize it or not.
The Abstraction Challenge
All of these problems compound when you try to build a scheduling abstraction across multiple orchestrators. Each one implements scheduling differently:
| Orchestrator | Native Mechanism | Time Specification |
|---|---|---|
| Kubeflow | Recurring Runs API | Cron, intervals, start/end time |
| Kubernetes | CronJob resources | Cron expressions only |
| Airflow | DAG scheduling | Cron, timetables |
| Vertex AI | PipelineJobSchedule | Cron expressions |
| SageMaker | PipelineSchedule | Cron, rate expressions |
| Databricks | Job Schedules | Quartz cron with required timezone |
Kubeflow supports catchup backfill. Kubernetes CronJobs don’t. Databricks requires explicit Java timezone IDs (like America/New_York, not UTC offsets). Some orchestrators support intervals, others only cron.
When you’re building an abstraction layer, you face a fundamental choice:
Intersection: Only expose what ALL orchestrators support. Safe and consistent, but you’re stuck with the least common denominator (basic cron).
Union: Expose everything, warn when a specific orchestrator can’t use it. More powerful, but behavior varies depending on what’s underneath.
Neither choice is obviously right. Intersection blocks users from capabilities their infrastructure actually supports. Union means features silently degrade when you switch orchestrators.
How ZenML Approaches This
At ZenML, we landed on union with graceful degradation. The Schedule configuration exposes the full feature set:
from zenml.config.schedule import Schedule

schedule = Schedule(
    name="daily-feature-engineering-prod",
    cron_expression="0 4 * * *",
    start_time=datetime(2025, 1, 1, 9, 0),
    end_time=datetime(2025, 12, 31, 23, 59),
    catchup=False
)

my_pipeline.with_options(schedule=schedule)()
When a feature isn’t supported by the target orchestrator, ZenML warns but doesn’t block:“
WARNING: Kubernetes orchestrator only uses `cron_expression`.The `catchup` and `interval_second` fields will be ignored.This means pipelines run (rather than failing with cryptic errors) while making the limitations visible.
The Feature Matrix
Not all fields work everywhere. Here’s the reality:
| Field | Kubeflow | K8s | Databricks | Vertex | SageMaker |
|---|---|---|---|---|---|
cron_expression | ✅ | ✅ | ✅* | ✅ | ✅ |
interval_second | ✅ | ❌ | ❌ | ❌ | ✅ |
start_time | ✅ | ❌ | ✅ | ✅ | ✅ |
end_time | ✅ | ❌ | ✅ | ✅ | ✅ |
catchup | ✅ | ❌ | ❌ | ❌ | ❌ |
*Databricks requires a schedule_timezone setting
Managing the Dual State Problem
Schedules exist in two places: ZenML’s metadata store and the orchestrator’s native system. Deleting a schedule from ZenML doesn’t automatically delete it from Vertex AI or SageMaker. This can create “ghost schedules” where pipelines continue running after you think you’ve stopped them.
ZenML addresses this with:
1. Lifecycle commands that work across the abstraction:
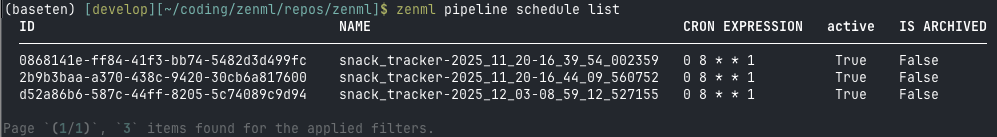
zenml pipeline schedule list
zenml pipeline schedule activate <name>
zenml pipeline schedule deactivate <name>
zenml pipeline schedule delete <name></name></name></name>
2. Soft delete by default: Preserves historical references in pipeline runs while marking the schedule as archived.
3. Explicit documentation of per-orchestrator cleanup requirements, because some orchestrators don’t support programmatic deletion.
Timezone: The Edge Case That Isn’t
Timezone handling turned out to be one of the most challenging UX issues. Cron expressions don’t carry timezone information—they’re interpreted by the orchestrator in its default timezone (usually UTC). Users expecting “9 AM local time” often get “9 AM UTC.”
ZenML normalizes timezone-aware datetimes to UTC internally, but this means users need to be explicit:
import pytz
local_tz = pytz.timezone('America/Los_Angeles')
local_time = local_tz.localize(datetime(2025, 1, 1, 9, 0))

schedule = Schedule(
    name="local-time-schedule",
    cron_expression="0 9 * * *",
    start_time=local_time  # ZenML converts to UTC
)
The abstraction leaks here, and we document it rather than hide it.
The Lesson
Building abstractions for scheduling reveals a recurring theme: simplicity is earned through understanding complexity.
The five fields in a cron expression hide questions about freshness, monitoring, resource contention, overrun behavior, and orchestrator compatibility. Every platform team building at scale eventually runs into some version of Twitter’s staleness problem, or LinkedIn’s monitoring gap, or Shopify’s thundering herd.
The honest answer isn’t that these problems disappear with better tooling. They don’t. But they can be made explicit—through feature matrices, warning messages, and documentation that tells you what you’re actually getting.
If you’re evaluating scheduling for ML pipelines, the questions worth asking aren’t about cron syntax. They’re about what happens when runs overlap, how you’ll know if data is actually fresh, and whether your chosen abstraction degrades gracefully or fails silently.
Those are the questions that matter at 2 AM when something isn’t working.
Want to see how ZenML handles schedules across different orchestrators? Check out the scheduling documentation or book a call to discuss your stack and use case.