On this page
Unlike traditional software, LLM-powered apps are hard to debug and manage once they hit production. Standard Application Performance Monitoring (APM) tools help, but they lack the nuanced visibility needed for LLM monitoring.
That’s where LLM observability tools come in. They let you trace LLM interactions, spot failures, stay compliant, and keep a closer watch on fast-growing bills.
In this guide, we cut through the noise and provide a complete breakdown of the 10 best LLM monitoring frameworks available in 2025. We cover what each tool does, its unique strengths, pricing, and pros and cons.
Quick Overview of the Best LLM Monitoring Tools
Here’s a quick overview of what the LLM monitoring tools in this guide are ‘best for:’
- ZenML: MLOps and engineering teams who need a unified control plane to connect production monitoring back to the exact code, data, and pipelines that created the model.
- LangSmith: Teams building with LangChain who need deep tracing, prompt testing, and structured evaluations in one place.
- Langfuse: Teams wanting an open-source, self-hostable monitoring layer with strong tracing, cost tracking, and collaboration.
- Arize Phoenix: RAG-heavy apps that need local-first tracing, offline evals, and rich visual analysis inside notebooks.
- Datadog LLM Observability: Enterprises already using Datadog who want LLM performance tied directly to infra and service metrics.
- W&B Weave: ML teams using W&B who want easy auto-logging, experiment comparison, and evaluation workflows.
- Helicone: Fast setup and low-effort monitoring via a proxy that logs requests, adds caching, and helps manage API costs.
- Portkey: Production teams needing an AI gateway with routing, guardrails, budgets, and detailed LLM-level metrics.
- Traceloop OpenLLMetry: Engineering teams wanting vendor-neutral tracing that plugs into existing OpenTelemetry backends.
- TruLens: Evaluating LLM agents with feedback functions and combining scoring with step-by-step tracing.
Factors to Consider when Selecting the Best LLM Monitoring Tools to Use
Here are some key factors to consider before choosing your ideal LLM monitoring tool:
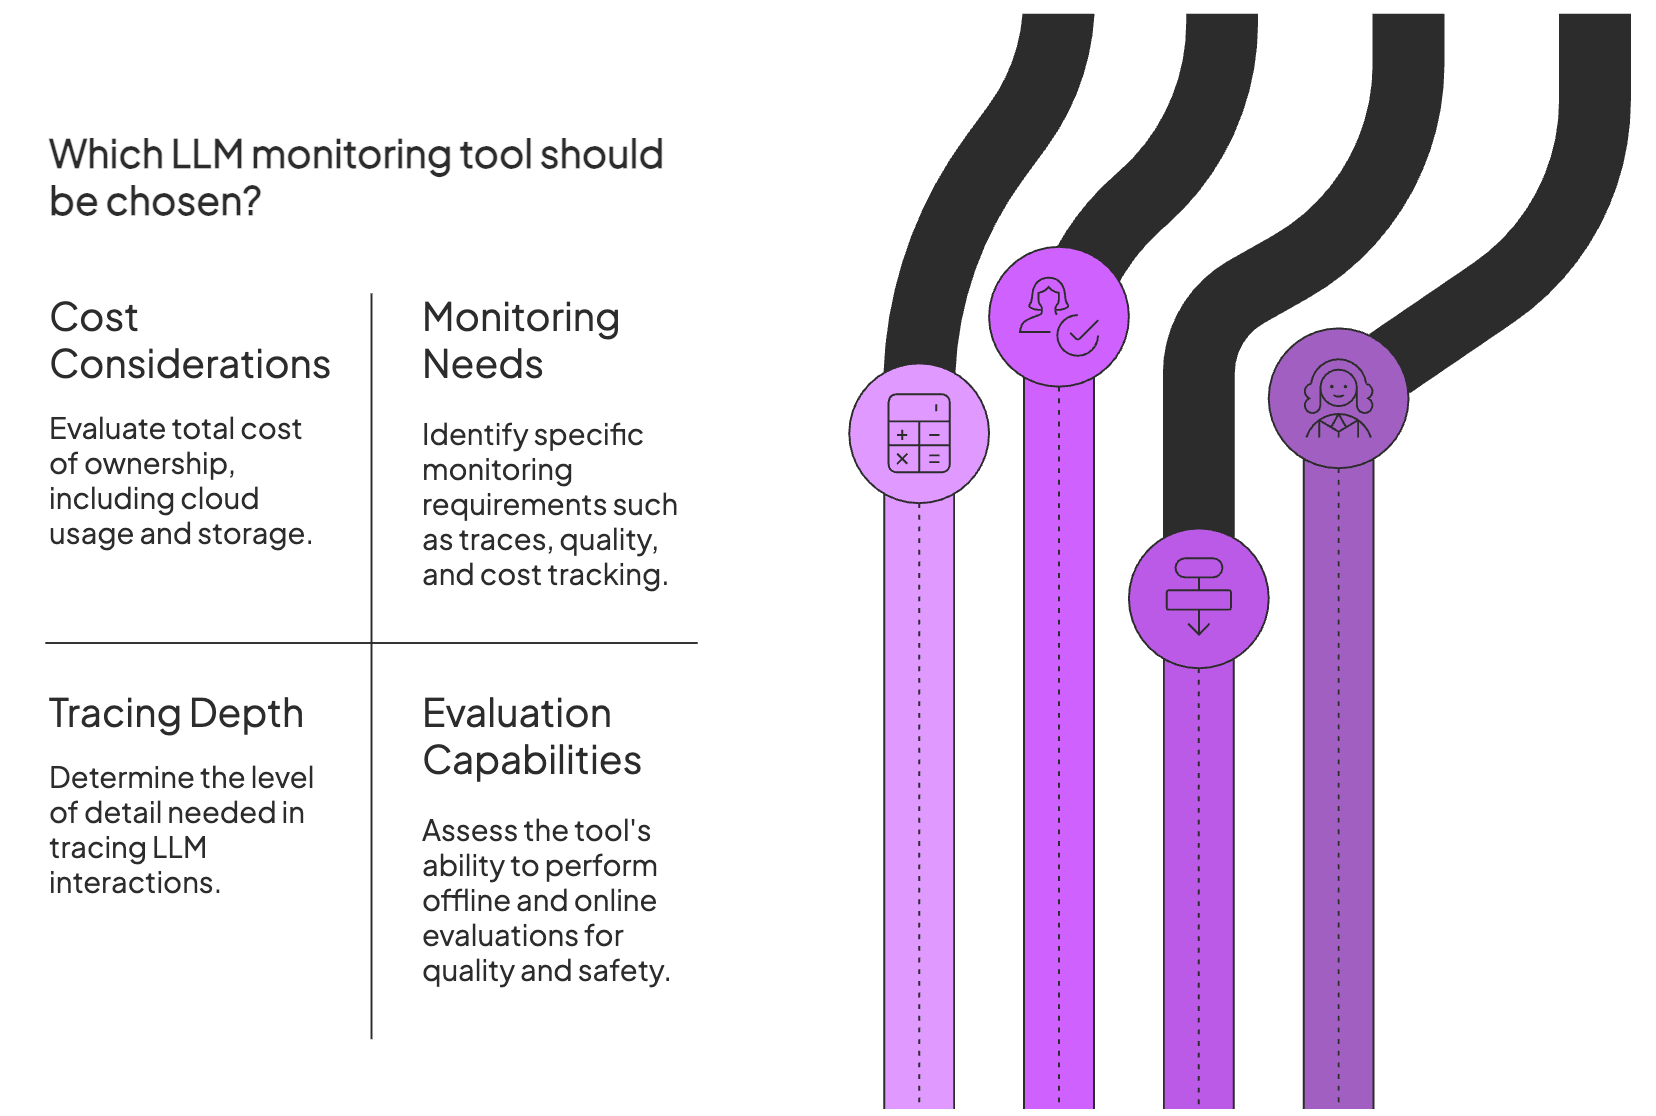
1. Associated Costs
LLM monitoring tools range from free open-source libraries to enterprise SaaS platforms. SaaS tools often charge per seat (user) or per request/trace, which can grow quickly for high-volume apps.
Open-source tools are free to run but usually need time and effort to deploy, host, and maintain.
For example, platforms like Datadog use usage-based pricing, while open-source options like Langfuse or TruLens cost nothing in license fees but leave infrastructure work to you.
Whatever you choose, think in terms of total cost of ownership. Factor in cloud usage, storage costs, and whether the value-to-cost ratio fits you in the long term.
2. What Exactly Do You Need to Monitor?
LLM applications have many moving parts. Before choosing a tool, clarify which pieces you actually need to see.
- Traces and latency: Do you need end-to-end traces for each prompt and every step it triggers? Look for tools that capture full request paths so you can debug slow or failing chains.
- Quality and evals: If accuracy or relevance matters, pick tools with built-in evaluation that score outputs and help you catch hallucinations or quality drops.
- Guardrails: Some tools ship with content safety checks or let you define custom policies. If you have strict rules, pick a tool that can run safety checks automatically or enforce rules at runtime.
- Cost tracking: LLM APIs can get expensive fast. If budget is a concern, choose tools that track token usage and let you set alerts on spend.
- Debugging tools: If you’ll iterate on prompts or models often, favor tools with prompt versioning, experiment tracking, or side-by-side output comparison.
3. Tracing depth and Context
Tracing depth is about how much of the app’s internal behavior gets recorded. Some tools only log the final prompt and response. Others capture every step, from retrieval calls to tool invocations and retries.
Look for tools that log the full sequence of an LLM interaction and give you more context. That context makes it easier to see where a multi-step pipeline went off track and which component you need to fix.
4. Evaluation Capabilities (Quality and Safety)
Look for tools that support both offline and online evaluation.
For example, offline eval might use a regression test suite of prompts with expected answers, while online eval could use an LLM-as-a-judge to score responses or collect user ratings.
Also, check whether the tool can test for safety and bias issues. Some frameworks ship with metrics for toxicity or bias checks. If you work in a regulated domain, a strong safety evaluation is not optional.
This leads to the obvious question: which LLM monitoring tool should you choose? The next section walks through the best frameworks in detail.
What are the Best LLM Monitoring Frameworks?
Before we dive in, here’s a quick comparison table:
| Tool | Key Features | Pricing |
|---|---|---|
| ZenML | - Unified Model Control Plane for end-to-end lineage connecting code, data, and models - Pipeline-integrated evaluations allowing for custom ‘LLM-as-a-judge’ steps before deployment - Deep artifact logging that ties metadata (tokens, latency) to specific model versions | - Free (Open-source Apache 2.0) - Enterprise (Custom pricing for managed control plane) |
| LangSmith | - Detailed trace viewer for prompts, tools, and intermediate steps - Prompt playground for experiments and version comparisons | - Free tier - Paid plans start at $39/user/mo - Enterprise |
| Langfuse | - Full trace logging with latency, retries, and cost details - Prompt versioning with comparison across datasets | - Free (Open-source) - Cloud plans (from $65/mo) |
| Arize Phoenix | - Local trace execution using OpenTelemetry - RAG-focused evals with relevance and LLM-judge scoring - Embedding, drift, and retrieval-quality visualizations | - Free (Open-source) - Paid plan (~$50/mo) |
| Datadog LLM Observability | - Unified tracing across backend services and LLM calls - Prompt clustering and sensitive-data scanning | Usage-based (Contact sales) |
| W&B Weave | - One-line instrumentation for prompt and output logging - Interactive run tables for filtering and version comparisons | - Free tier - Pro ($60/user/mo) - Enterprise |
| Helicone | - Proxy-based logging for prompts, outputs, latency, and tokens - Response caching to cut API costs | - Free tier - Pro ($20/user/mo) - Team ($200/mo) |
| Portkey | - Trace logging with 40+ request attributes - Multi-provider routing and budget alerts | - Free tier - Production plan ($49/mo) - Enterprise |
| Traceloop OpenLLMetry | - OTel-based instrumentation for LangChain, LlamaIndex, and API calls - Configurable filtering and sampling for privacy and storage control | - Free (Open-source) - Cloud free tier - Enterprise |
| TruLens | - Feedback functions for groundedness, relevance, and correctness - OTel-based tracing of tools, retrieval calls, and agent steps | Free (Open-source) |
1. ZenML
Best For: MLOps and engineering teams who need a unified control plane to connect production monitoring back to the exact code, data, and pipelines that created the model.
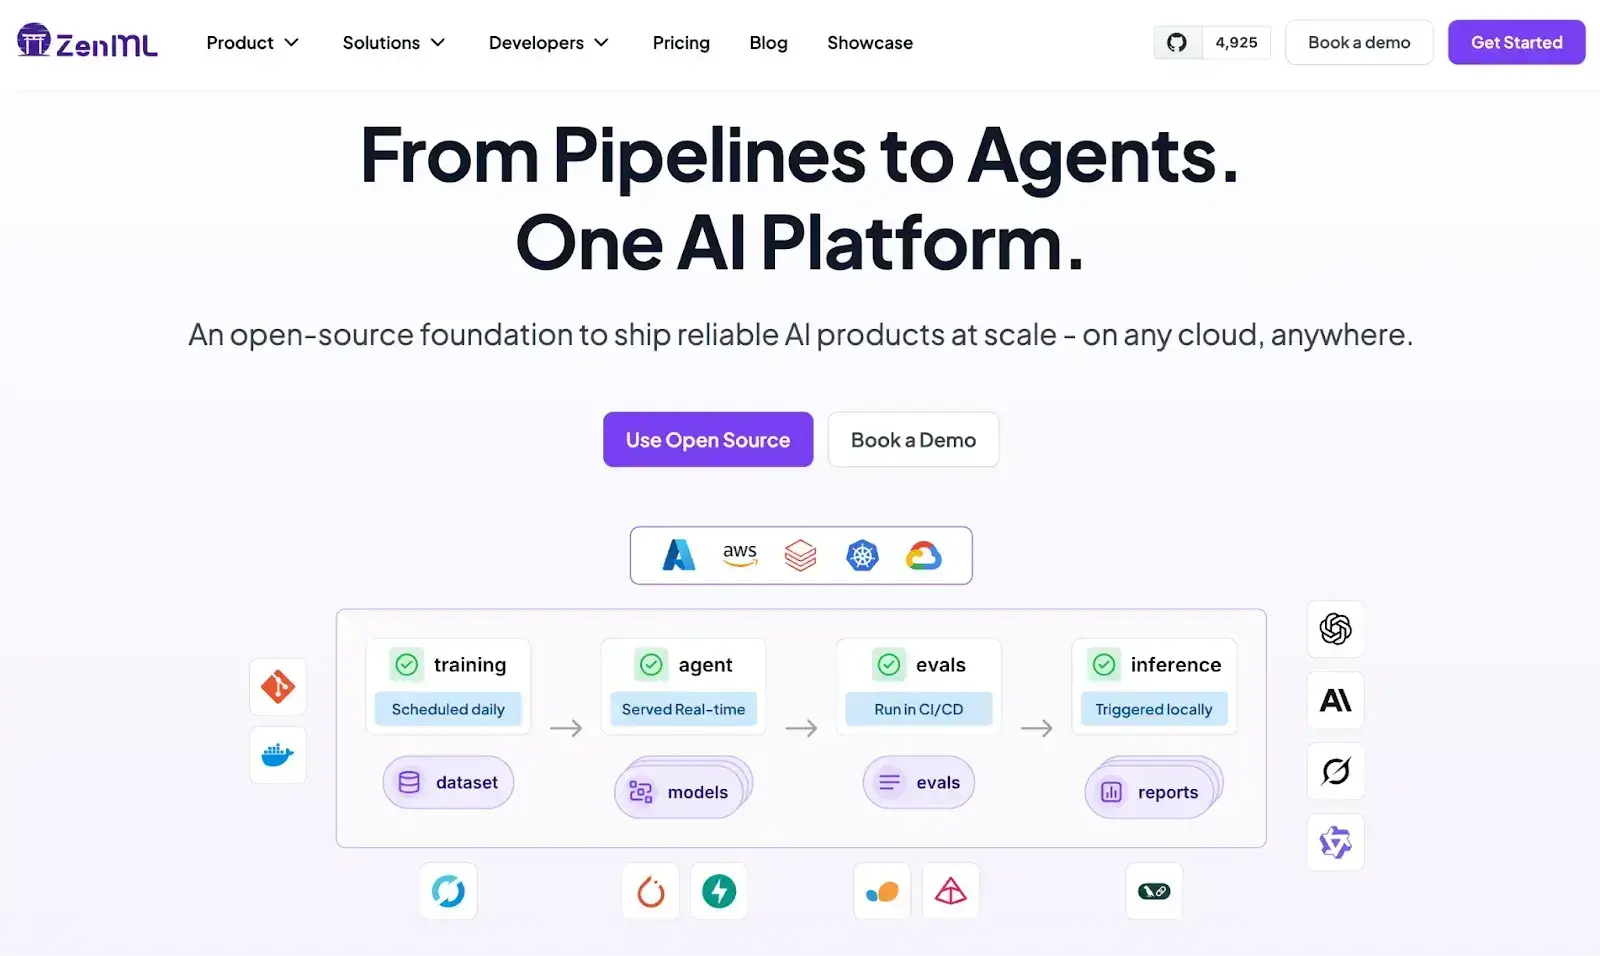
ZenML stands out as the best monitoring solution on the market because it treats observability not as an afterthought, but as a fundamental part of the model’s lifecycle.
Unlike point solutions that only watch the output of an LLM, ZenML creates a ‘system of record’ for your entire AI stack.
It connects your data, code, and infrastructure, meaning when you spot an issue in production, you don’t just see what went wrong; you can trace it back to the exact dataset, code version, and training parameters that caused it.
Key Feature 1. Model Control Plane
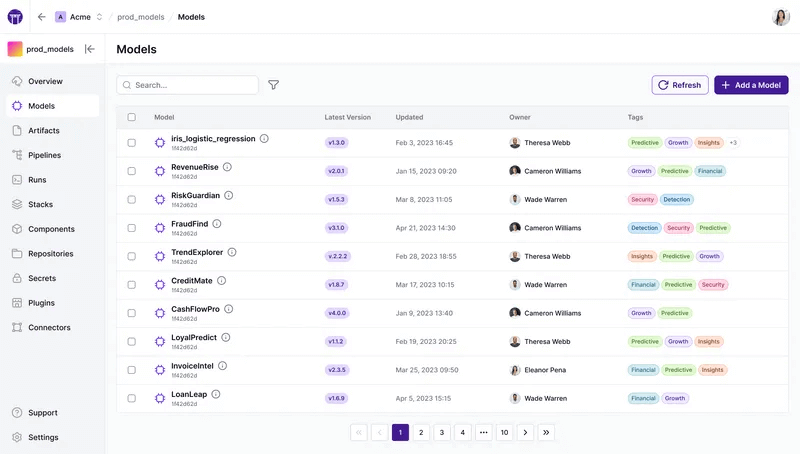
ZenML provides a centralized dashboard that acts as a single pane of glass for all your models and agents.
It tracks lineage automatically, allowing you to see exactly how a deployed model was created, which data it was trained or evaluated on, and where it is currently deployed.
Key Feature 2. Built-in Evaluation Workflows
Rather than relying on external tools, ZenML allows you to build evaluation directly into your pipelines.
You can run offline evaluations using ‘LLM-as-a-judge’ patterns or standard metrics as distinct steps in your workflow, ensuring that no model promotion happens without passing rigorous quality gates.
Key Feature 3. Metrics, Logs, and Model Metadata for LLM Steps
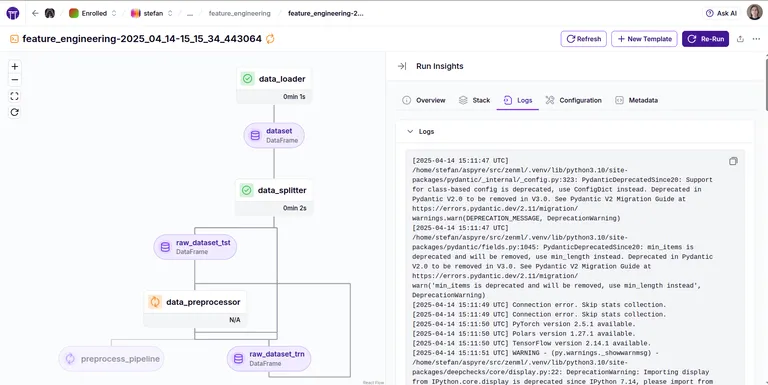
ZenML’s SDK allows developers to log rich metadata, like token usage, latency, and prompt versions, directly within pipeline steps using the log_metadata function.
This data is automatically associated with the specific model version and artifact runs, making it searchable and visualized via the dashboard for deep debugging context.
Pricing
ZenML is free and open-source under the Apache 2.0 license. The core framework, dashboard, and orchestration capabilities are fully available at no cost.
Teams needing enterprise-grade collaboration, managed hosting, advanced governance features, and premium support can opt for ZenML’s custom business plans, which vary by deployment model, usage, and team size.
Pros and Cons
ZenML’s primary advantage is its holistic approach; it provides end-to-end lineage that links production errors back to the specific code and data that generated them, offering a depth of context that proxy-based loggers cannot match. Additionally, its tool-agnostic nature means you can swap out underlying providers (like vector DBs or model APIs) without losing your monitoring history.
However, because ZenML is a full MLOps + LLMOps framework rather than a plug-and-play monitoring dashboard, it requires a higher initial engineering investment to structure your code into pipelines compared to simpler, API-proxy tools.
2. LangSmith
LangSmith is an observability and evaluation platform from the LangChain team. It’s especially popular with LangChain users because it hooks into LangChain callbacks and data structures, but it can work with any LLM stack.
Features
- Capture every step of an LLM run with traces that record prompts, tool calls, intermediate outputs, latency, and token usage.
- Inspect chain or agent behavior through a visual trace view that lets you open each step and compare inputs and outputs.
- Test prompts in the playground and compare model or prompt variations side by side to refine behavior quickly.
- Score responses with automated LLM-based evaluations or human reviews to track quality and detect regressions.
- Monitor live performance with dashboards for cost, latency, errors, and quality scores, plus alerts for unusual changes.
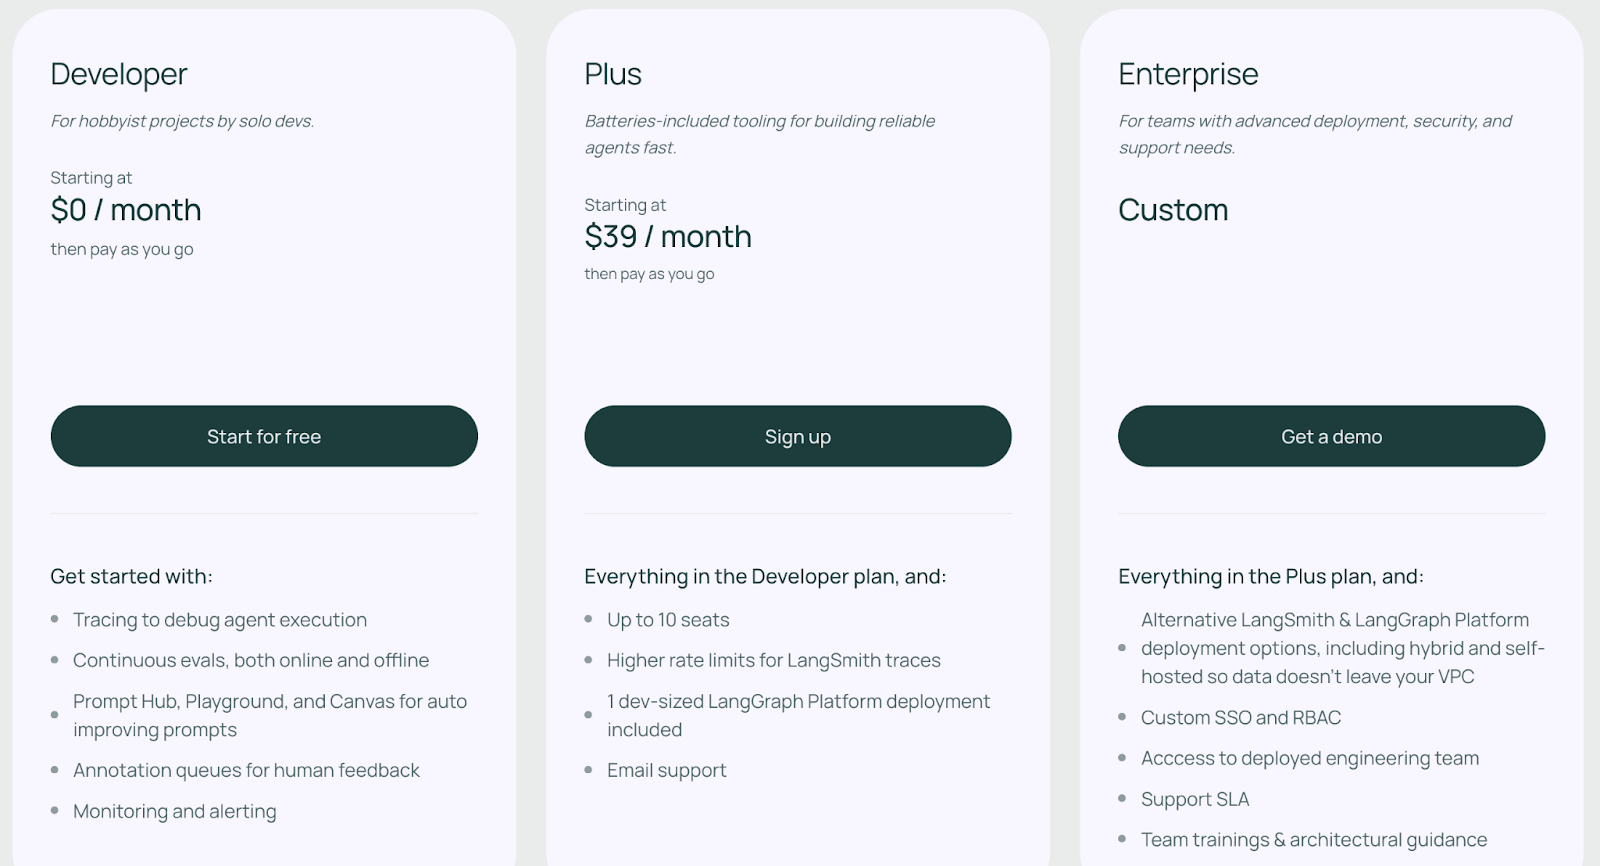
Pricing
LangSmith has a free developer plan that typically includes 1 developer seat and up to 5,000 traces per month. Other than that, it has two paid plans:
- Plus: $39 per seat per month
- Enterprise: Custom pricing
Pros and Cons
LangSmith’s biggest strength is its tight integration with the Langchain ecosystem. The trace viewer makes multi-step agent loops easier to debug, and the evaluation suite helps you compare prompts or model versions with repeatable tests. Its dashboards, versioning, and prompt playground make sense for teams that iterate often and run structured experiments.
The trade-offs are mostly around control and cost. LangSmith is a paid platform with a limited free tier, so most teams will need seats once usage grows. Self-hosting is reserved for enterprise deals, which can be a blocker for privacy-heavy environments. And while it’s framework agnostic, the experience is clearly tuned first for LangChain, so other frameworks may need extra setup.
📚 Read more about LangSmith:
3. Langfuse
Langfuse is an open-source LLM monitoring tool focused on end-to-end tracing, analytics, and cost tracking. You can self-host it, inspect runs in a browser UI, and log events through its SDK or via OpenTelemetry, turning it into a central logbook for all LLM activity.
Features
- Record every LLM call and inspect inputs, outputs, retries, latency, and costs in an expandable trace view.
- Share trace links and comment on steps to debug issues together and replay full sessions for multi-turn analysis.
- Version prompts in a dedicated prompt hub to test variations and compare performance across datasets.
- Track token usage and spend with dashboards that surface expensive calls and alert you when budgets are near limits.
Pricing
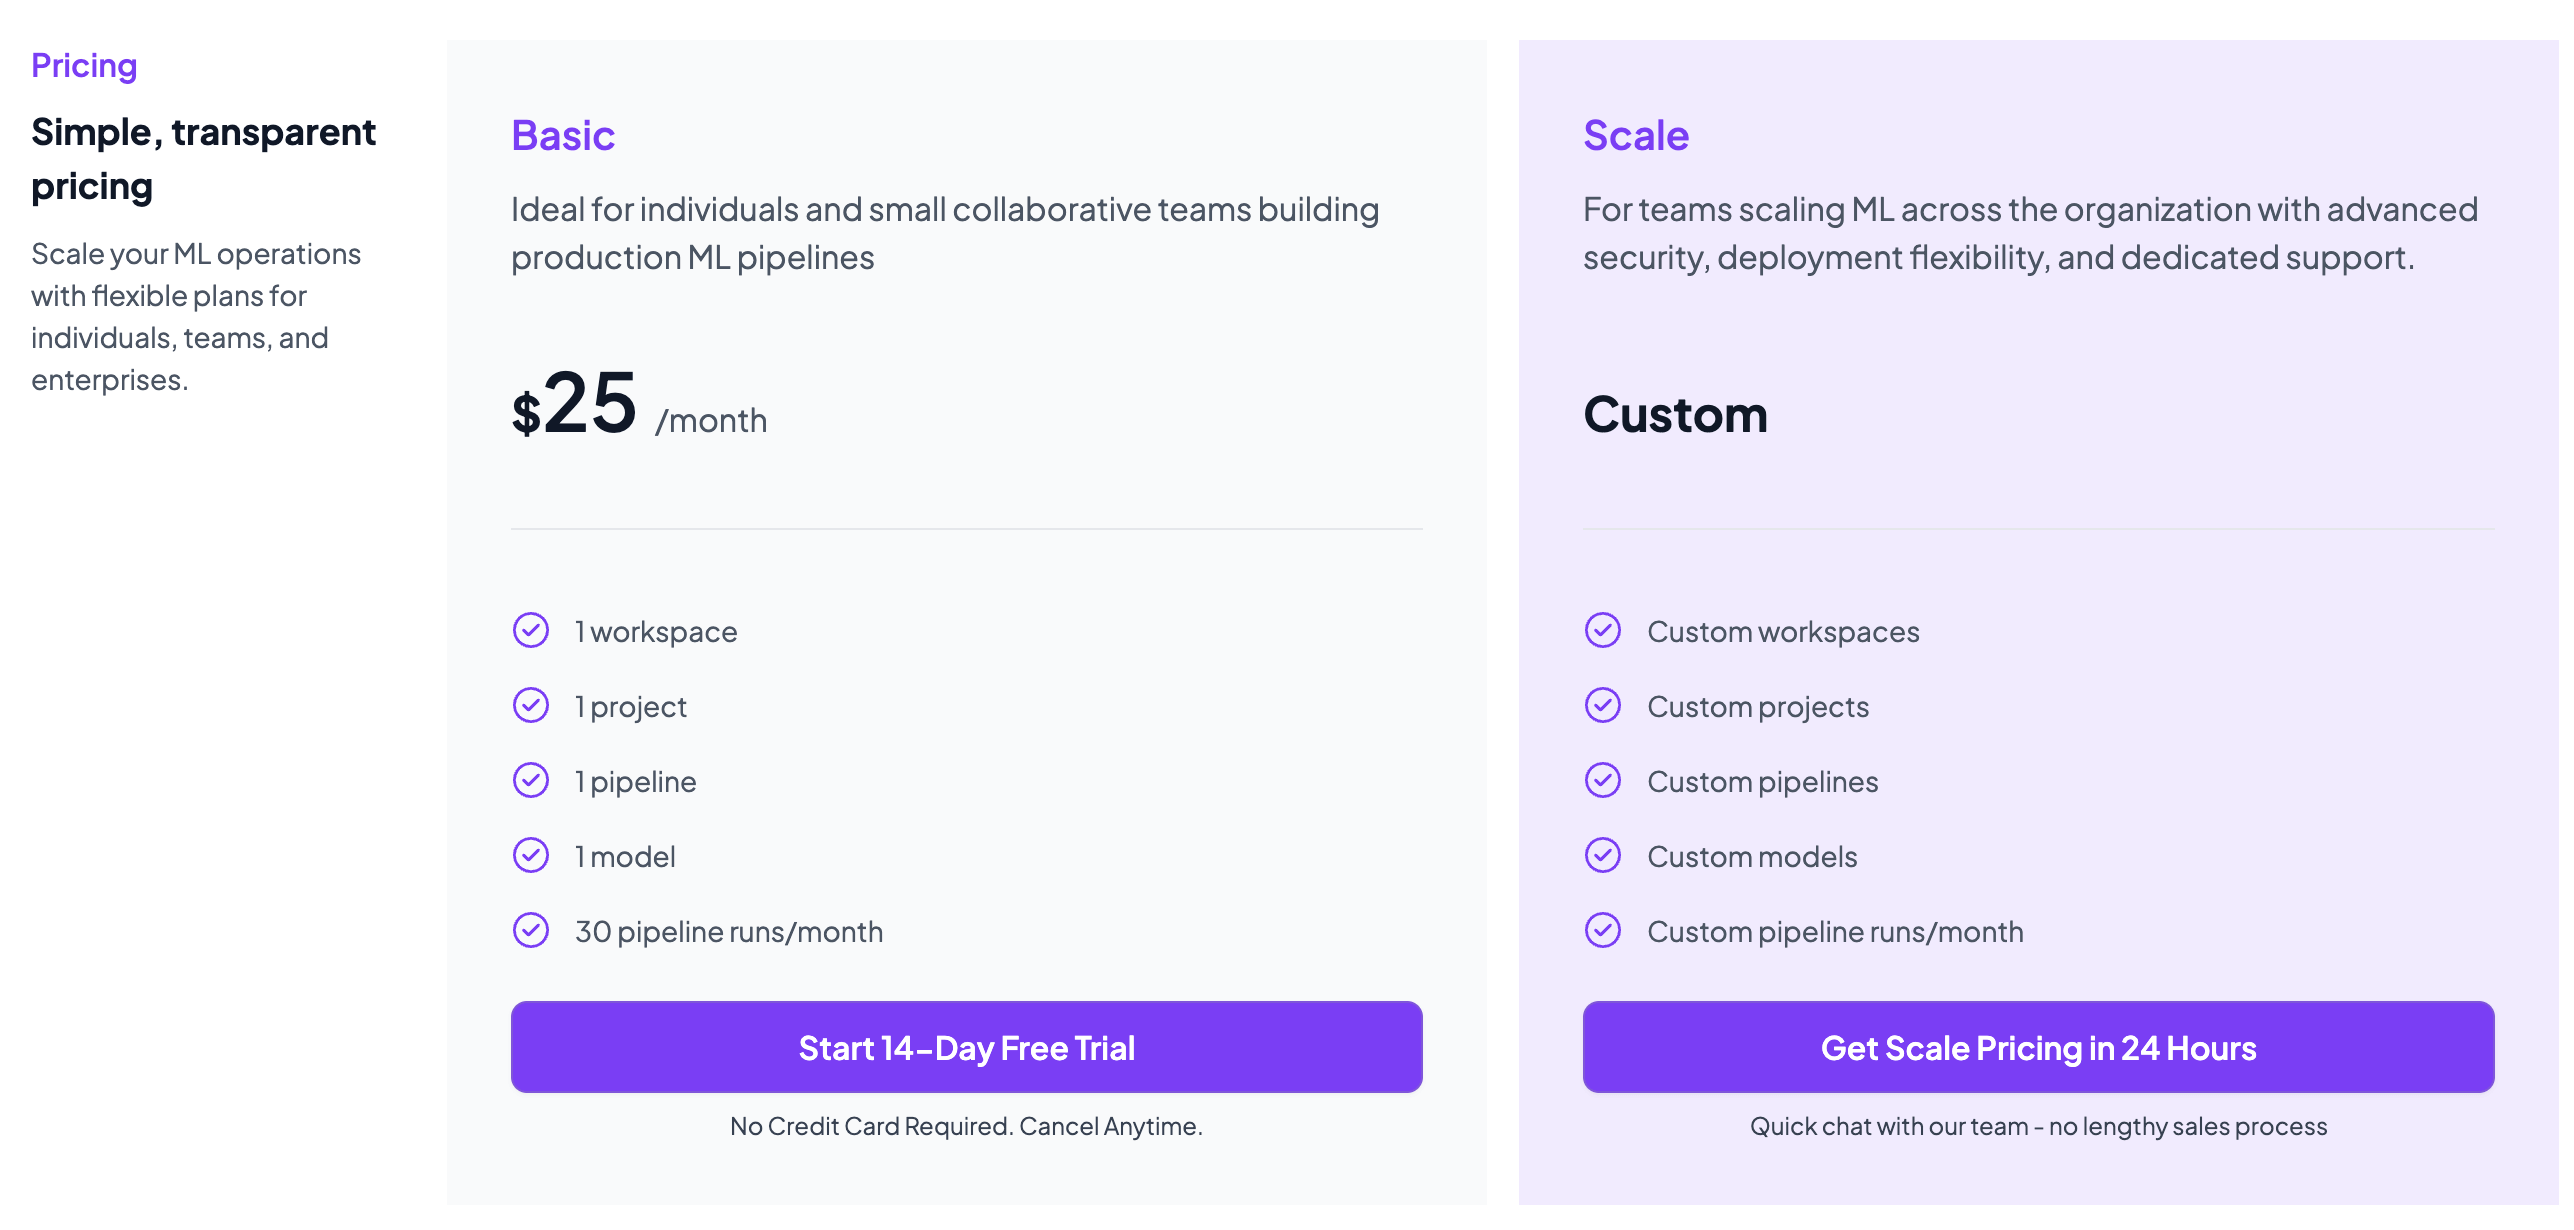
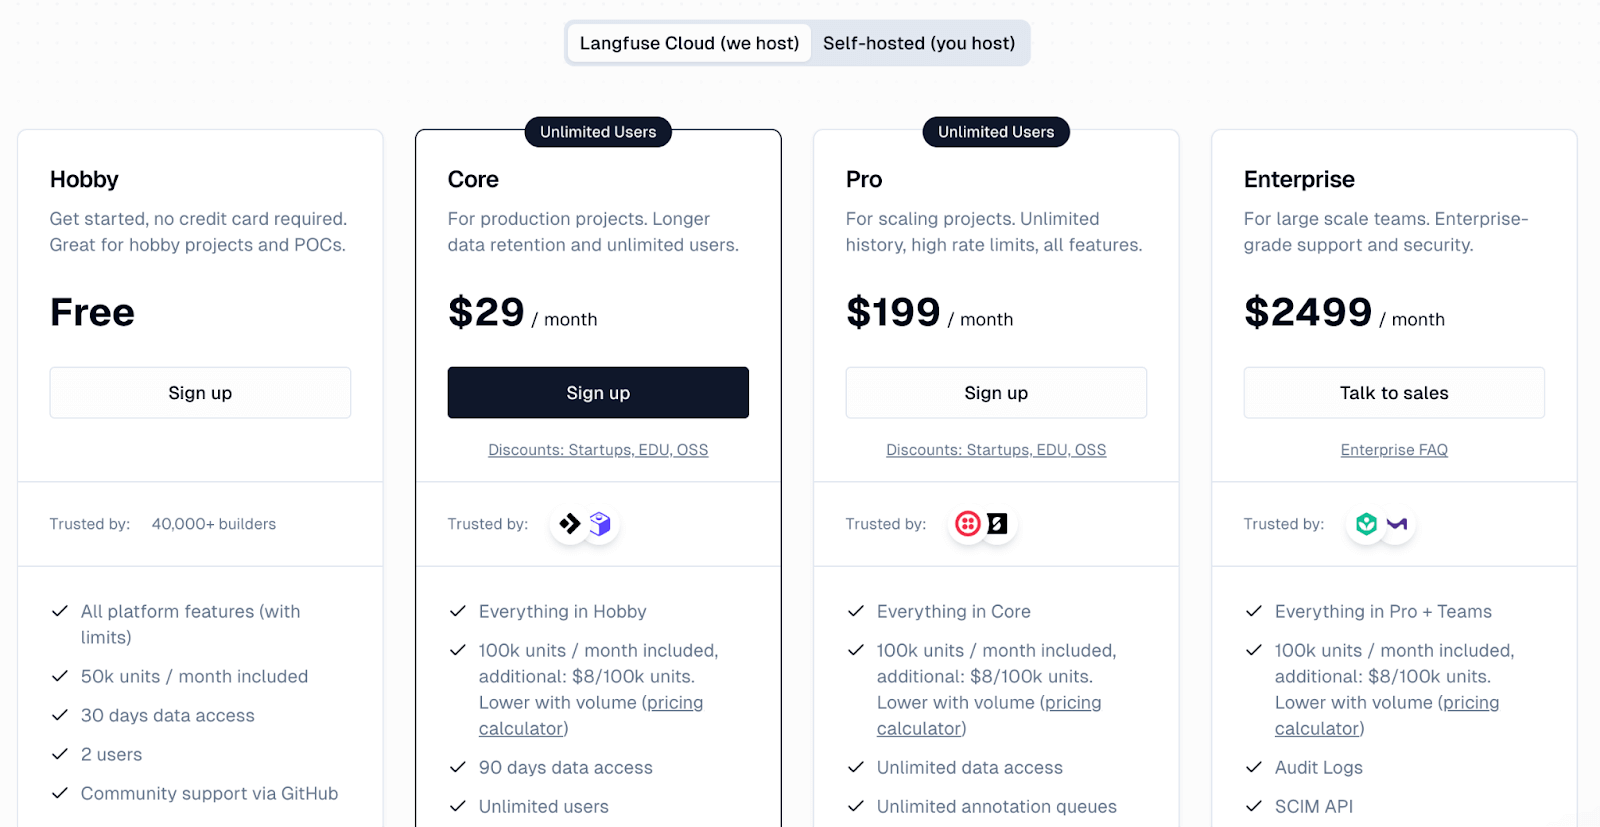
Langfuse offers a free Hobby plan on its cloud platform, which includes 50k units per month and two users. Paid plans include:
- Core: $29 per month
- Pro: $199 per month
- Enterprise: $2499 per month
Pros and Cons
Langfuse’s strength lies in its open-source nature with a well-rounded feature set. You would benefit from its collaborative workflow, since shared trace links and comments make debugging far more efficient.
The trade-off is setup effort. You have to instrument your app and choose which metadata to send, and self-hosting adds infra work if you don’t use the managed cloud. The UI is clean but not as polished as some commercial tools, and a few advanced workflows still need extra wiring on your side.
4. Arize Phoenix
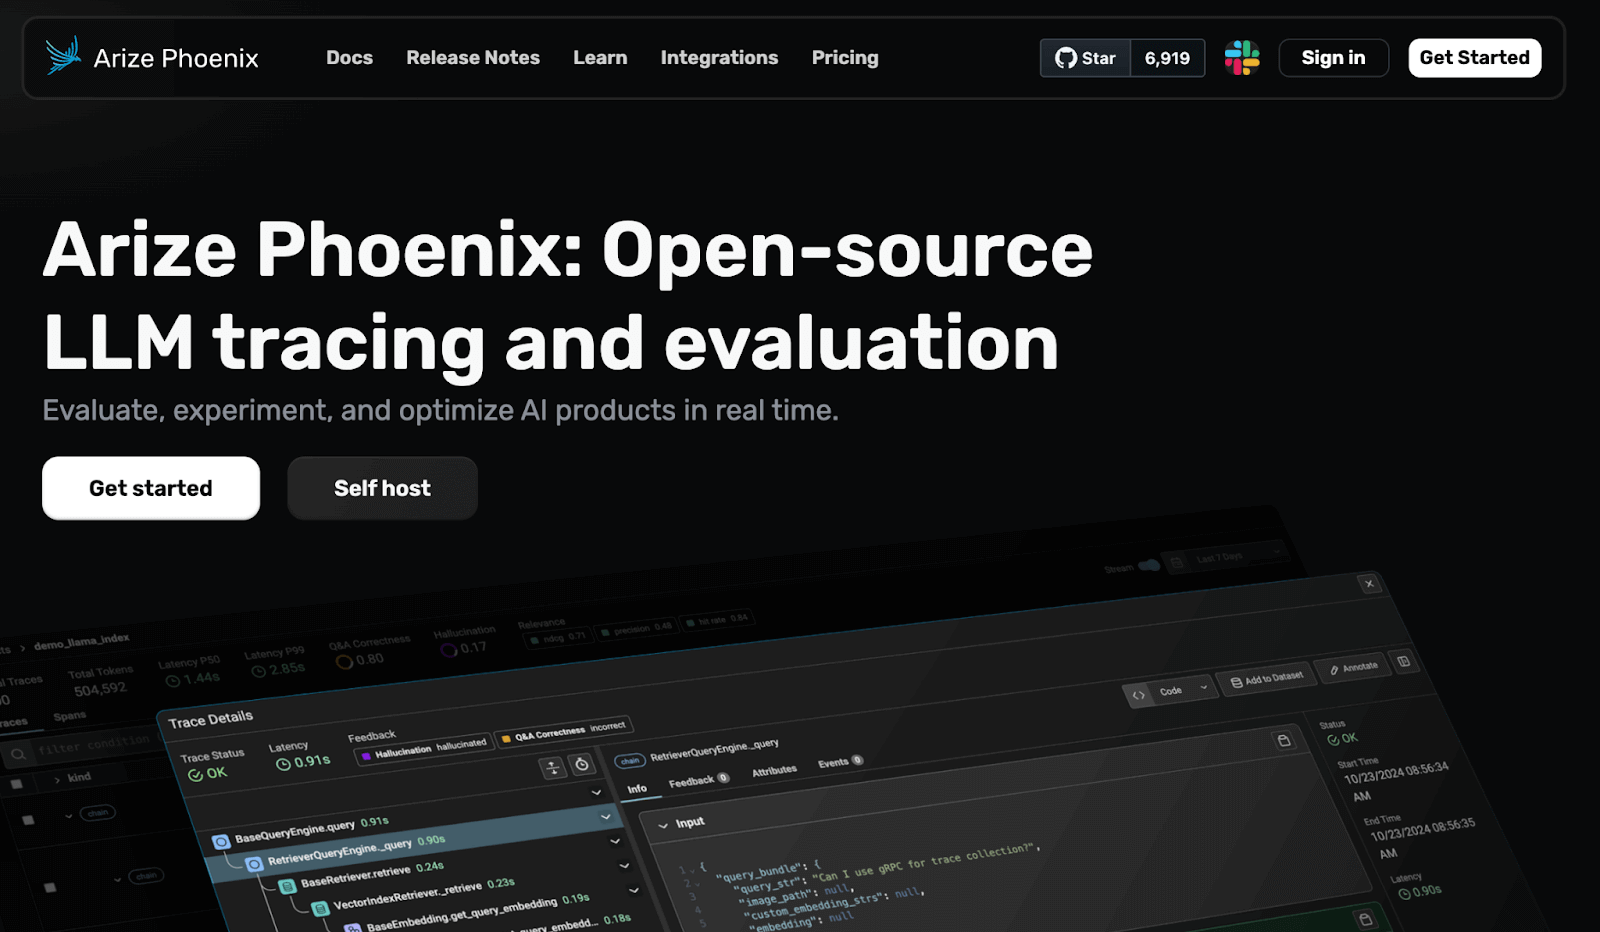
Arize Phoenix is an open-source LLM observability tool from Arize AI. It runs in local environments like Jupyter notebooks or containers and is built on OpenTelemetry. Phoenix is widely used for retrieval-augmented generation and LLM-powered search or chat systems.
Features
- Supports local-first debugging with full visibility into prompts, outputs, timing, and spans using OpenTelemetry-compatible instrumentation.
- Score RAG outputs through offline evals, LLM-judge checks, and relevance metrics that reveal retrieval quality issues.
- Visualize model behavior with charts for embeddings, similarity patterns, drift signals, and performance distributions.
- Integrate with standard OpenTelemetry conventions, as well as LangChain, LlamaIndex, and OpenInference standards without lock-in.
Pricing
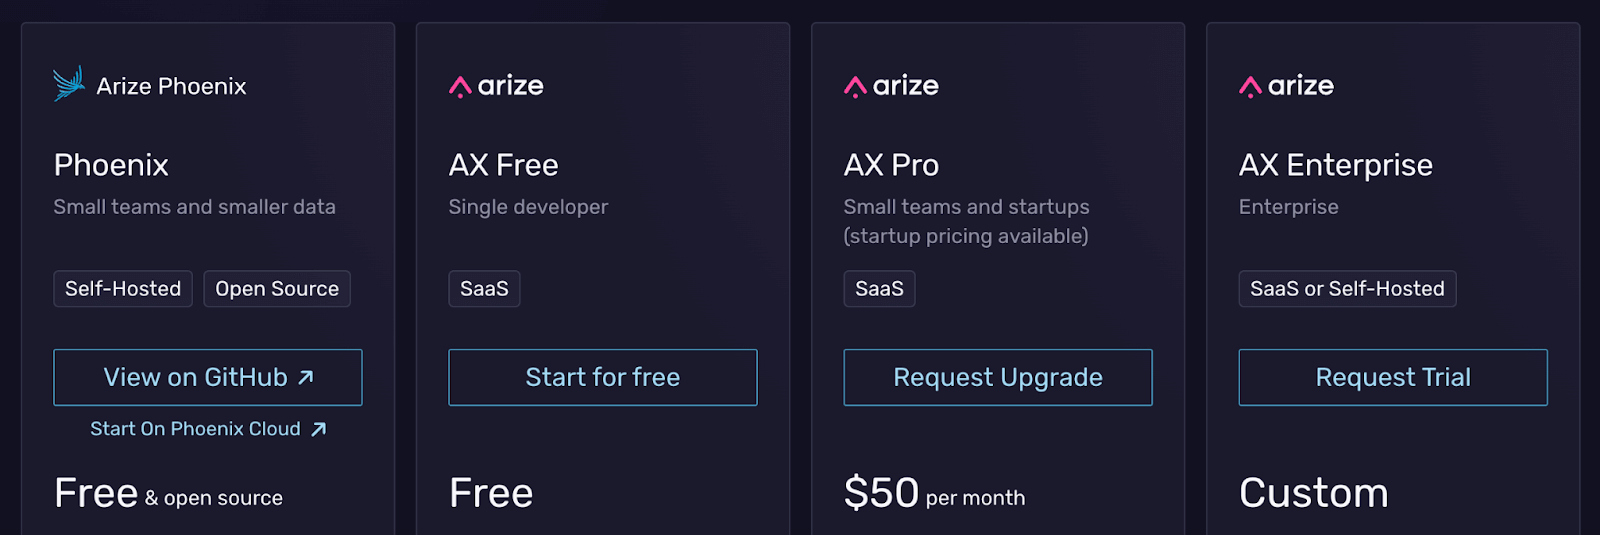
Phoenix is completely open-source and free to use as a standalone library. It can also feed into the hosted Arize AX platform, which is a paid service with:
- Arize AX Free: Free
- AX Pro: $50 per month
- AX Enterprise: Custom pricing
Pros and Cons
Phoenix’s notebook-native visualizations are extremely helpful when debugging RAG applications. Its OpenTelemetry base makes it easy to plug into existing observability stacks. The evaluation tools, especially for RAG, make it easier to diagnose retrieval issues and improve answer accuracy.
Phoenix can feel like too much if you just need basic logging. The UI expects users who are comfortable exploring charts and metrics, so there is a learning curve. Running it locally or inside notebooks also means extra work to fit it into production flows or scale it beyond a single machine.
5. Datadog LLM Observability
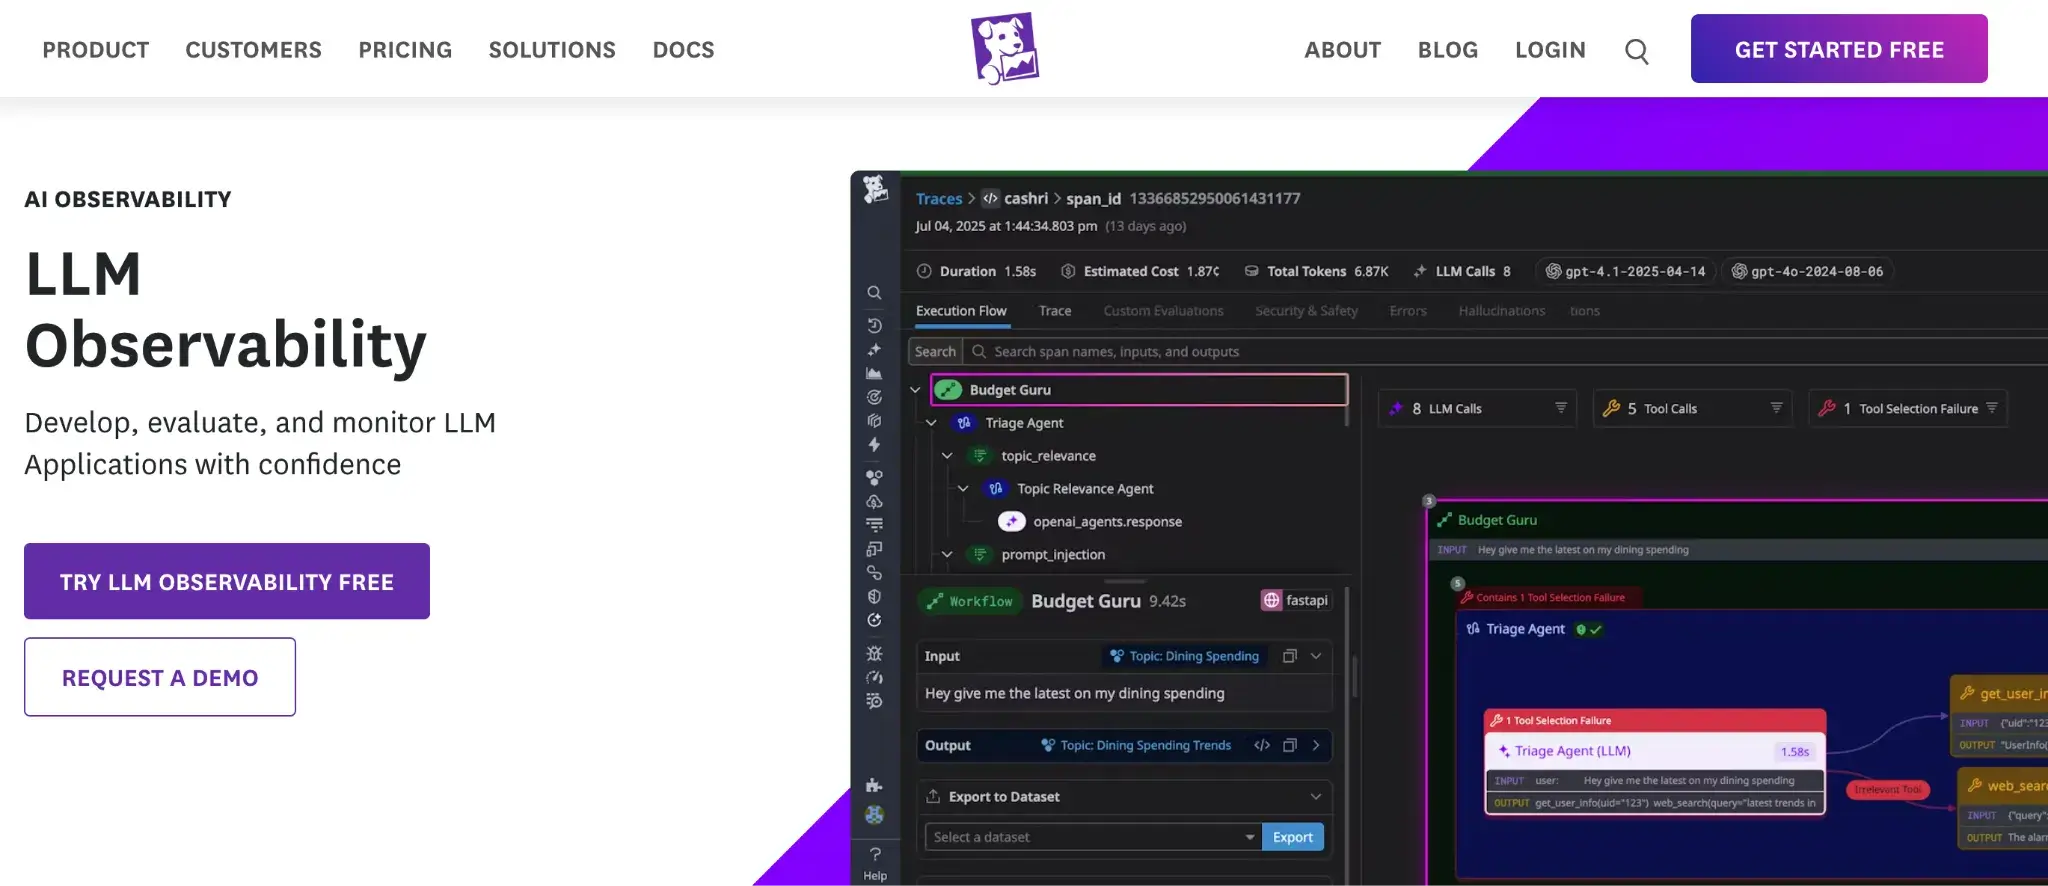
Datadog extends its enterprise APM platform with dedicated features for LLM observability. For teams that already use Datadog for infrastructure and microservice monitoring, this gives a native way to plug LLM traces and metrics into the same view.
Features
- Trace LLM calls across your stack and connect them with existing service traces to spot latency and error sources quickly.
- Cluster similar prompts and responses to surface patterns, safety risks, or policy violations while removing sensitive data with built-in scanners.
- Monitor usage with prebuilt dashboards that track request volume, latency, token consumption, and errors alongside your infra metrics.
- Enable LLM monitoring through updated APM agents that auto-capture spans for popular providers with minimal configuration.
Pricing
Datadog LLM Observability is an add-on within the Datadog platform, not a separate product. Pricing is usage-based, so you need to talk to sales for an exact quote.
Pros and Cons
The Datadog add-on is a strong fit for complex production environments. If your team already lives inside Datadog dashboards, LLM traces simply become another data stream with no extra tools to learn. Correlating LLM spans with service-level metrics helps you track down incidents faster, and the platform’s maturity and integrations appeal to growing companies.
If you’re not already in the Datadog ecosystem, adopting it only for LLM observability may be more work than it’s worth. It also lacks deeper qualitative features like prompt management or rich LLM-as-a-judge flows. In many cases, you would want a more focused LLM tool for fine-grained debugging.
6. W&B Weave (Weights & Biases)
W&B Weave is an LLM monitoring and evaluation tool built on top of the core W&B platform. It makes logging and analyzing LLM interactions as easy as adding a single line of code to your app and is particularly appealing to teams already using W&B for model tracking.
Features
- Capture every LLM call with one-line instrumentation that logs prompts, outputs, tokens, and latency without restructuring your code.
- Score responses using built-in evals, LLM-judge checks, and custom metrics to measure accuracy, relevance, and safety.
- Review runs in interactive tables that let you filter by metadata, compare prompt or model versions, and track quality trends over time.
- Organize experiments with tags, versioning, and team dashboards that keep a clear history of model behavior across iterations.
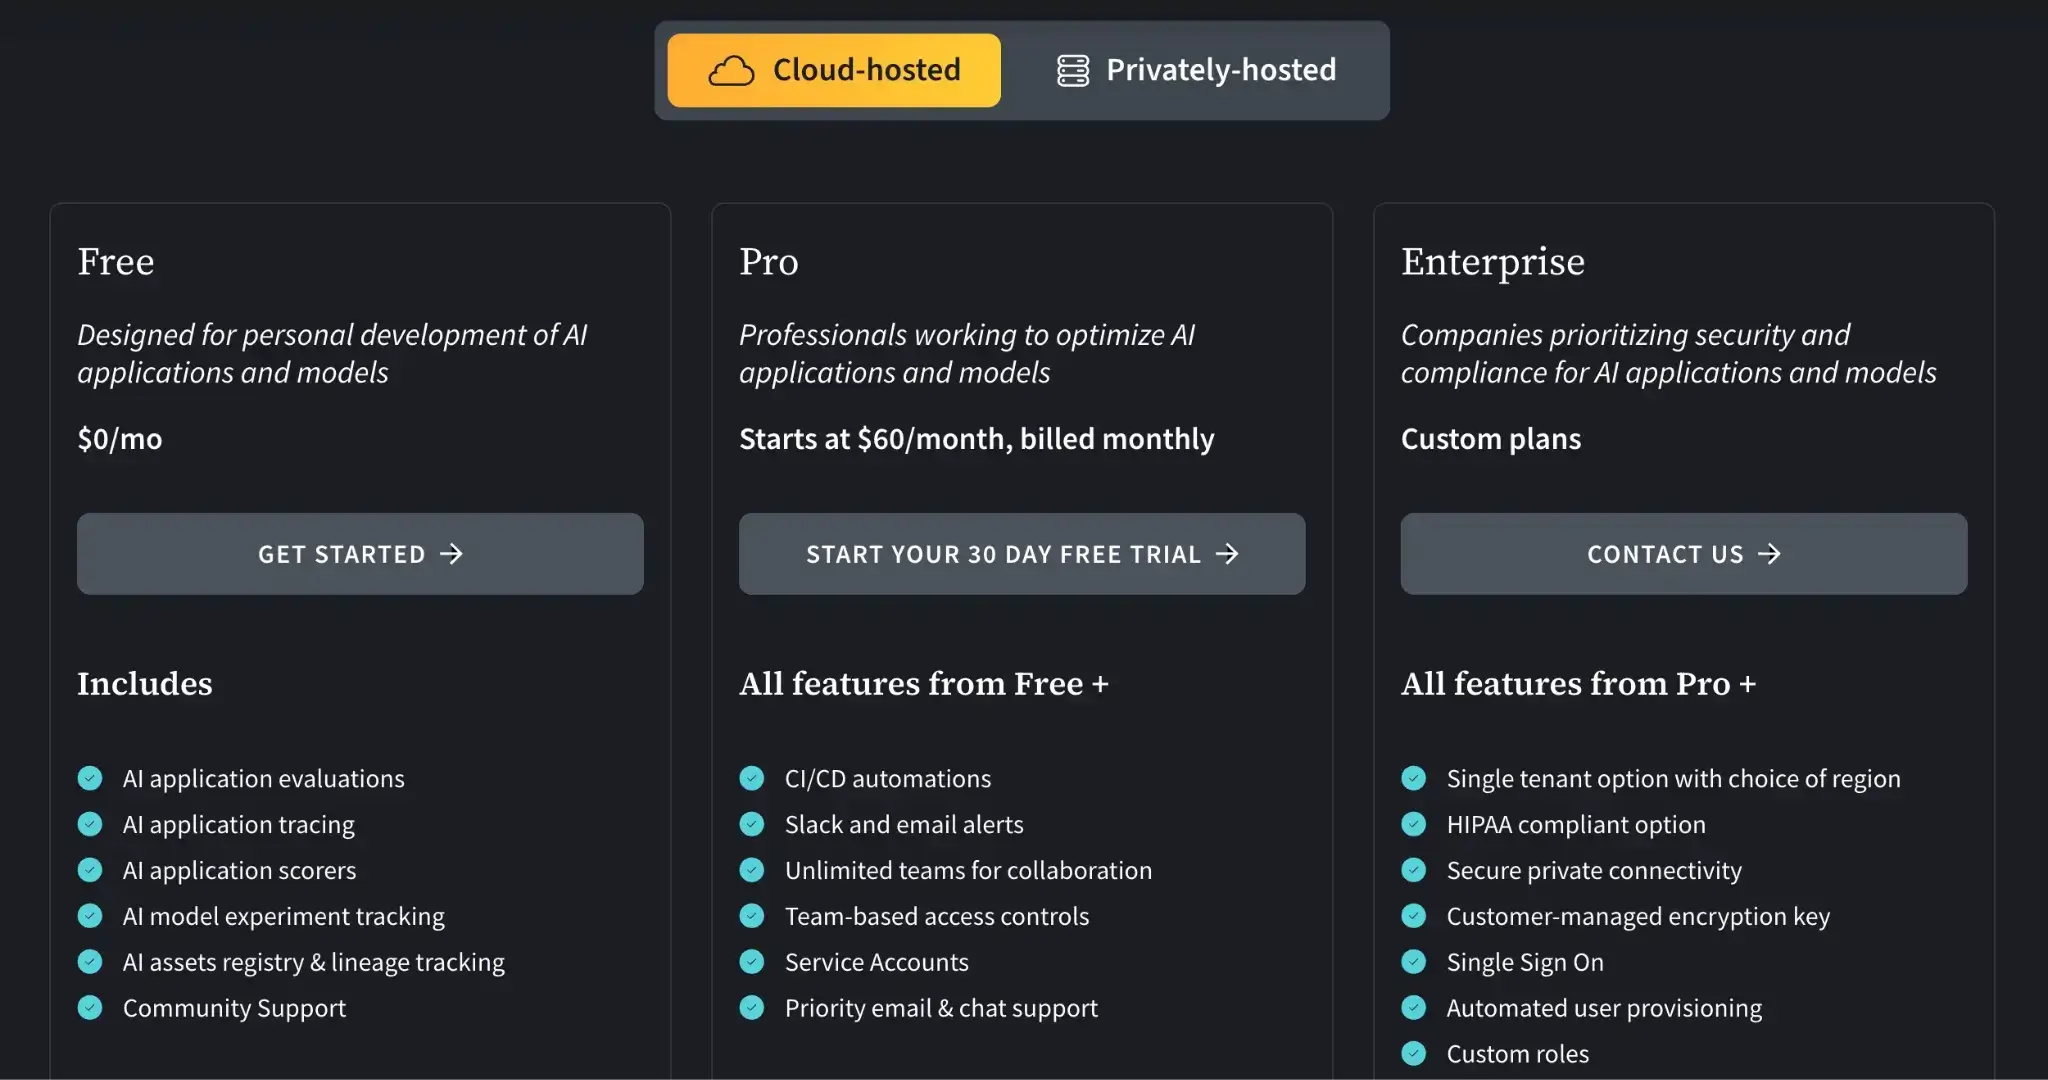
Pricing
W&B Weave offers a free plan for individual use. For teams, it offers two paid plans:
- Pro: $60 per month
- Enterprise: Custom
Pros and Cons
Weave fits neatly into the broader MLOps workflow. Observability data sits next to experiment runs and model registry entries, which keep context in one place. You rarely have to reshape your code or process, so the barrier to getting started is low. For teams already using W&B, it feels like a natural extension into LLM monitoring.
The flip side is commitment to the W&B ecosystem. If your team prefers separate, modular tools, that may be a concern. Weave also doesn’t focus on step-by-step tracing the way some dedicated observability platforms do, so you might pair it with another tool for that level of debugging.
7. Helicone
Helicone is a lightweight, proxy-based LLM observability tool that operates as an AI Gateway. Instead of instrumenting your code with SDKs, you send OpenAI or other LLM API calls through the Helicone proxy, and it logs requests and responses automatically.
Features
- Log every LLM request through a proxy that captures prompts, outputs, latency, tokens, and user-level metadata.
- View LLM usage metrics in a clean, visual dashboard that lets you filter by user, model, or endpoint and inspect individual responses.
- Reduce costs with intelligent response caching for repeated queries and provide custom rate limiting to manage usage spikes.
- Tag requests with custom metadata to group and analyze segment sessions, users, and features for granular insights.
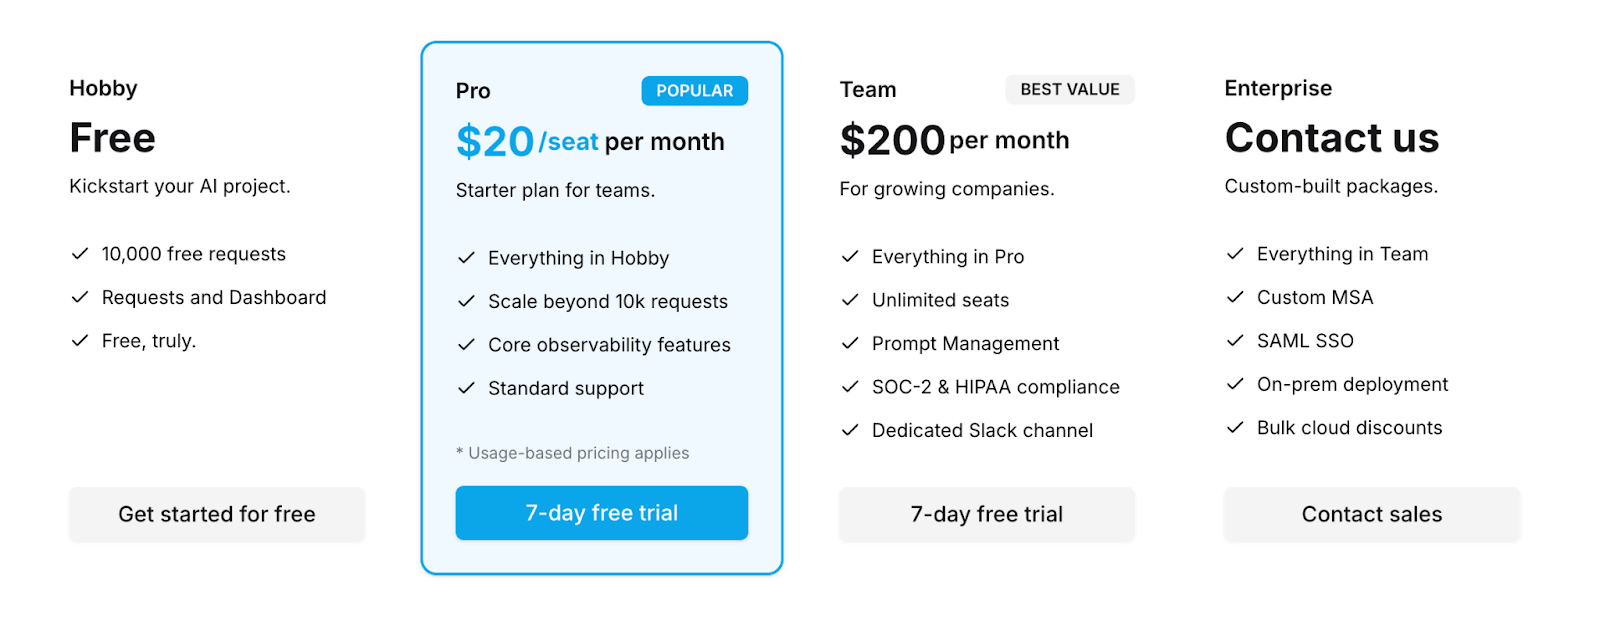
Pricing
Helicone offers a free Hobby plan that includes 10,000 requests. Above that, you can continue with its paid plans:
- Pro: $20 per seat per month
- Team: $200 per month
- Enterprise: Custom pricing
Pros and Cons
Helicone is fast to set up. You can get monitoring running in minutes just by changing the API endpoint your app calls. Its caching layer can cut costs when queries repeat, which is attractive for startups that need something cheap and quick to roll out. Those two traits make it a good pick for early-stage teams that need basic observability and cost control without extra engineering work.
However, inserting a proxy adds an extra hop that can fail or add latency to requests. Because Helicone operates mainly at the proxy level, it only sees what’s in the API call, not the internal state or logic in your app. Complex chains and agents may still need separate logging inside the application to be fully debuggable. For some teams, that means Helicone is a first step rather than a full observability story.
7. Portkey
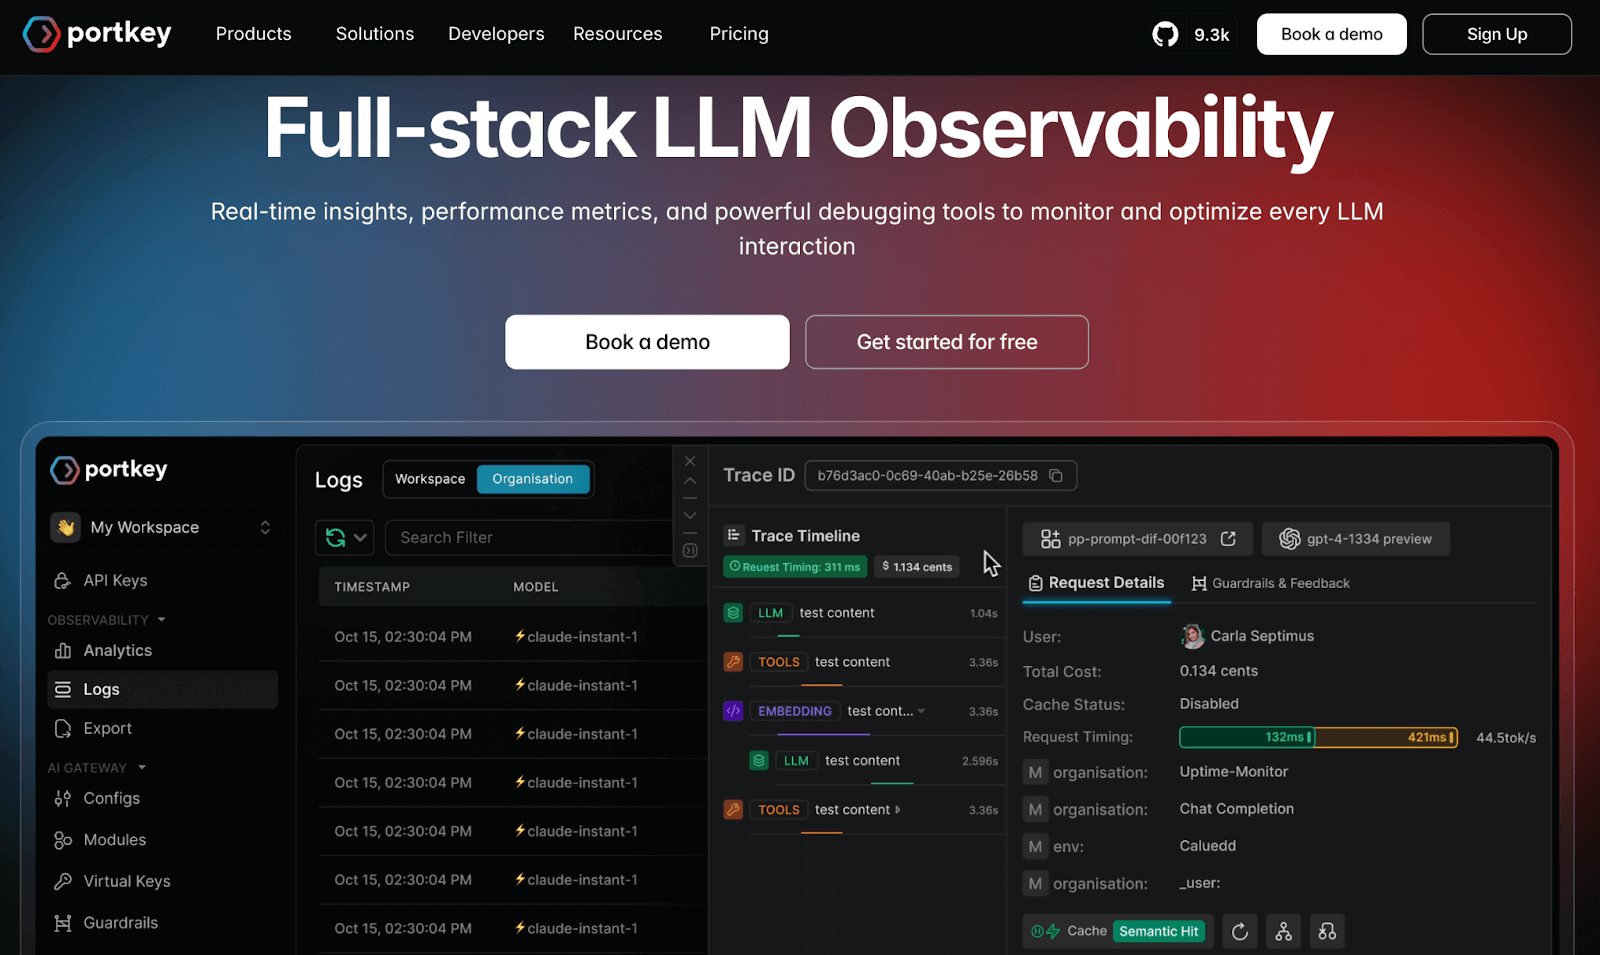
Portkey is an AI gateway and control plane that includes robust LLM observability features. It’s like a managed API gateway for your LLM calls, offering request routing, authentication, caching, and built-in monitoring.
Features
- Log every LLM request with 40+ attributes, then inspect full trace lifecycles through searchable, filter-rich views.
- Has a unified Trace View for tracking the entire lifecycle of an LLM request, with over 15 filters to drill down on metrics like unit cost and user feedback
- Monitor latency, errors, usage, and token spend through detailed dashboards, and export metrics via OpenTelemetry when needed.
- Built-in cost control mechanisms like real-time budget tracking, overuse alerts, and rate limiting are configurable per user.
- Enforce guardrails by filtering, modifying, or blocking unsafe prompts and responses directly at the gateway level.
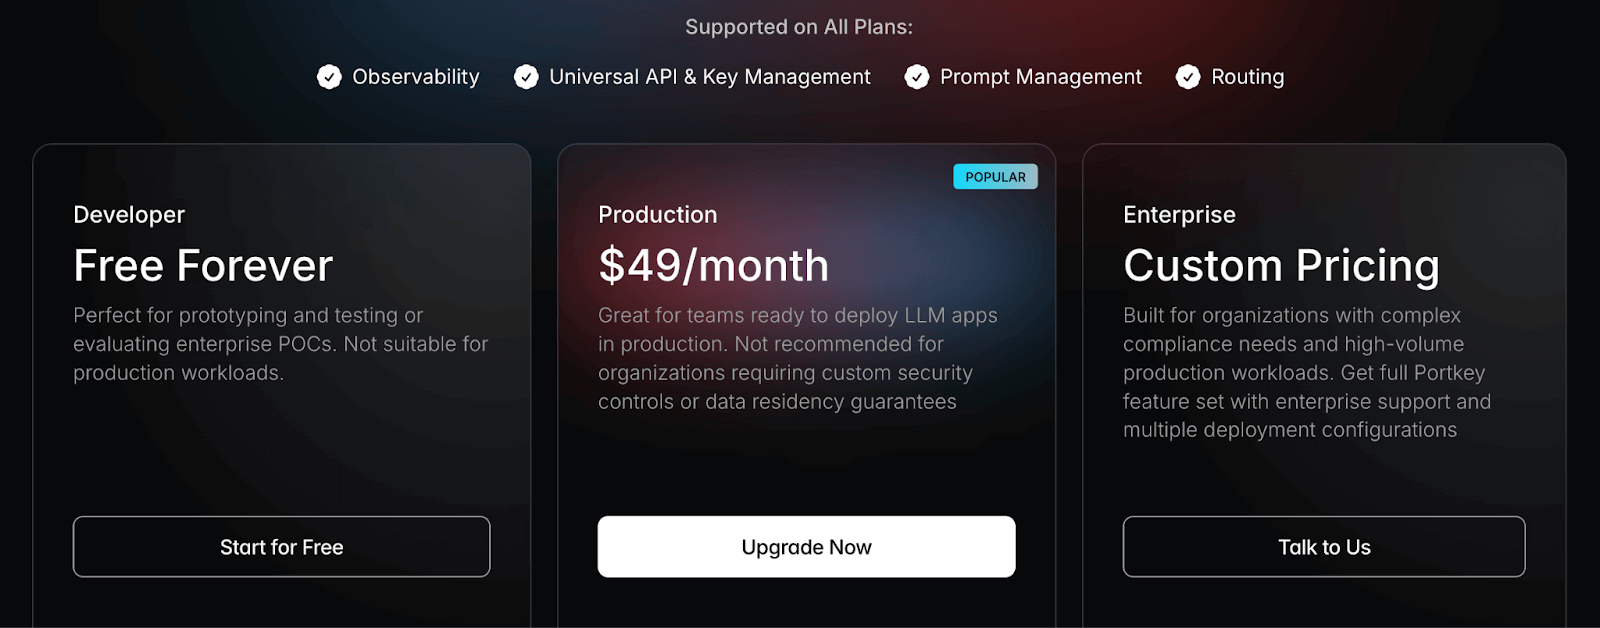
Pricing
Portkey offers a free Developer plan with up to 10k recorded logs per month. Over that, it has two premium plans:
- Production: $49 per month
- Enterprise: Custom pricing
Pros and Cons
Portkey’s major advantage is that it combines observability with production tooling. For a team looking to deploy a serious LLM-powered service, Portkey can eliminate the need to build a lot of infrastructure around the LLM. You get logging, monitoring, plus API management features in one package.
The trade-offs come from that same gateway model. You have to route all LLM traffic through Portkey and work inside its interface and concepts. There’s also some vendor risk/lock-in in that if you deeply integrate Portkey, especially its guardrails. And as a newer platform, it still has a few rough edges and may not cover every niche integration out of the box.
9. Traceloop OpenLLMetry
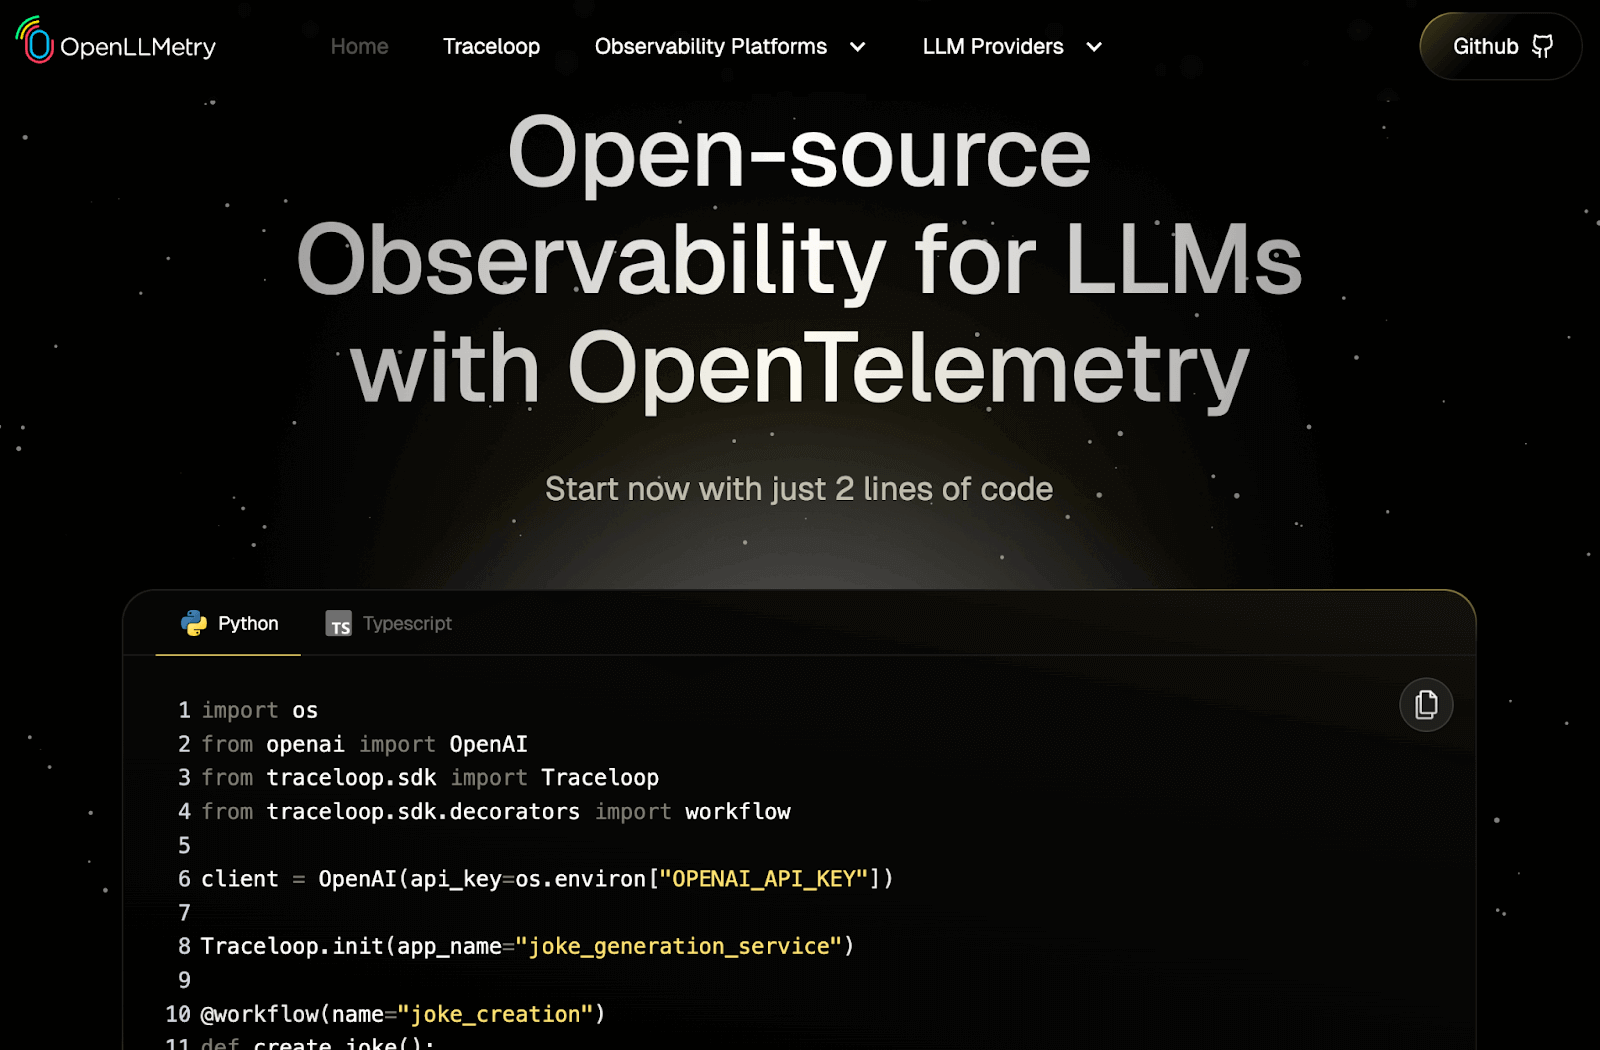
OpenLLMetry by Traceloop is an open-source SDK and standard for sourcing LLM observability data via OpenTelemetry. It gives you a vendor-neutral way to instrument your app using the standard OTLP protocol and send traces to any OTel-compatible backend.
Features
- Capture LLM traces through OpenTelemetry, then send spans to any backend like Datadog, Grafana, or Honeycomb for unified analysis.
- Instrument LangChain, LlamaIndex, and direct LLM API calls automatically to log prompts, tool calls, and timing without manual logging.
- Filter sensitive data or reduce trace volume using standard OTel sampling and processors for tighter control over privacy and storage.
- Use Traceloop Cloud as an optional backend to view prompt and response spans in an interface built specifically for LLM workloads.
Pricing
OpenLLMetry is entirely open source and free to use.
Pros and Cons
OpenLLMetry’s main benefit is its flexibility and adherence to open standards. You can plug it into whichever observability backend you already use, keep ownership of your data, and avoid being tied to a single vendor.
The downside is that it’s just instrumentation. You still need an OTel collector and a backend to store and view your traces, which adds setup work. Teams that want an out-of-the-box UI and hosted service will need to pair OpenLLMetry with another tool, whether that’s Traceloop Cloud or a third-party stack.
10. TruLens
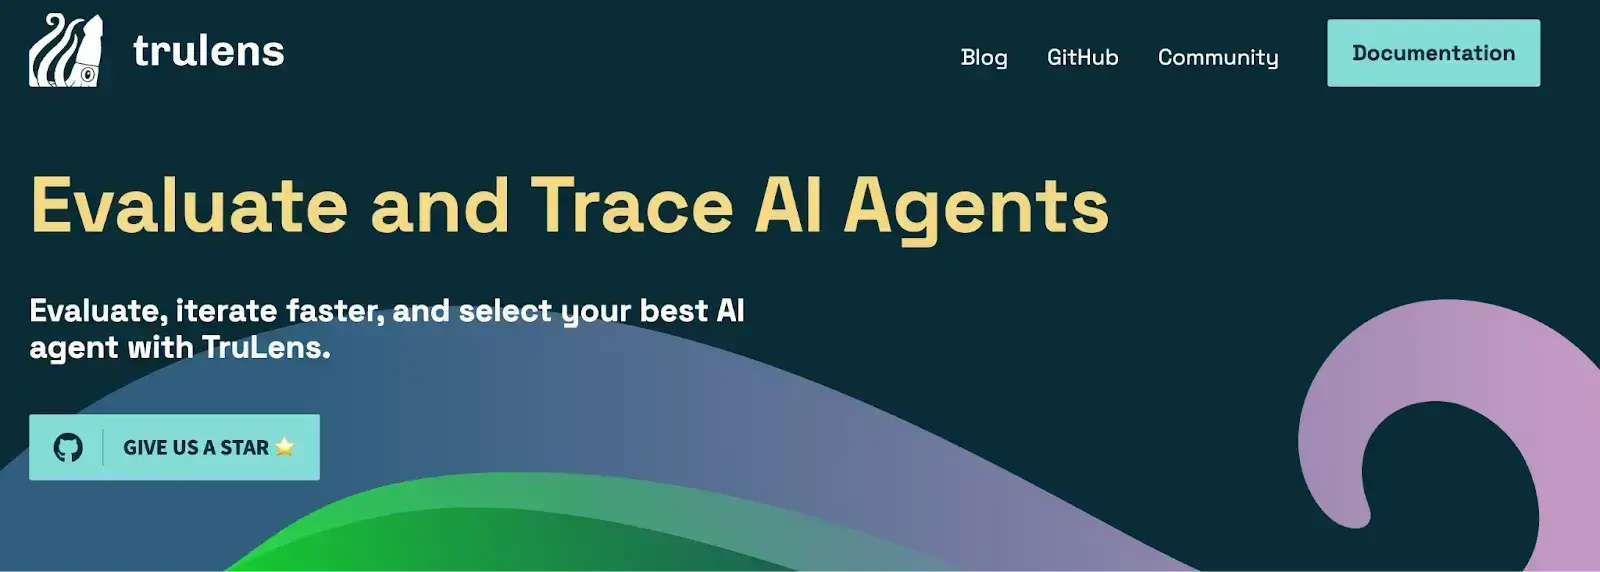
TruLens is an open-source library supported by Snowflake. It focuses on evaluating and tracing LLM-based agents and applications using feedback functions. That is, metrics that describe how well the model behaved. Because it can both trace and score runs, it’s helpful for improving agent-style systems.
Features
- Apply built-in feedback functions to score groundedness, relevance, correctness, and other quality signals across LLM outputs.
- Trace agent steps with OpenTelemetry to record tool calls, retrieval actions, and intermediate decisions in sequence.
- Review runs in a lightweight dashboard that displays feedback scores and compares versions side by side in a leaderboard view.
- Analyze agent behavior in RAG and multi-step workflows by combining evaluations with detailed traces for deeper insight.
Pricing
TruLens is an open-source, community-driven library and is free to install and use, with no usage fees or cloud hosting costs.
Pros and Cons
TruLens’s feedback functions save you from building evaluation logic from scratch. The combination of tracing and scoring makes it easier to see both where an answer went wrong and why. For teams tuning RAG systems or agent workflows, it gives a clear, open-source route to structured evaluation.
The main drawback is that it doesn’t aim to be a full monitoring stack. The dashboard is basic, and there are no built-in real-time alerts, so you still need another layer to watch live traffic. It is also Python-first, so non-Python teams or those who want a zero-setup experience may feel some friction getting started.
Which LLM Monitoring Tool is the Right Choice for You?
By this point, one thing should be clear: there is no single ‘best’ LLM monitoring tool, only a tool that fits your stack and your team.
Here are our top three tool recommendations:
✅ ZenML**: **For MLOps and engineering teams who need a unified control plane to connect production monitoring back to the exact code, data, and pipelines that created the model.
✅ Langfuse: For teams prioritizing self-hosting, open-source control, strong tracing, and cost dashboards with fewer SaaS dependencies.
✅ W&B Weave: If your team already uses Weights & Biases and wants to keep LLM monitoring integrated with your existing experiment tracking and model workflows.
📚 Relevant alternative articles to read:
- Best LLM orchestration frameworks
- Best LLM evaluation tools
- Best embedding models for RAG
- Best LLM observability tools
Take your AI agent projects to the next level with ZenML. We have built first-class support for agentic frameworks (like CrewAI, LangGraph, and more) inside ZenML, for our users who like pushing boundaries of what AI agents can do. With ZenML, you can seamlessly integrate whichever agent framework you choose into robust, production-grade workflows.